
Heal the Bay Releases Annual Beach Report Card & River Report Card 2021
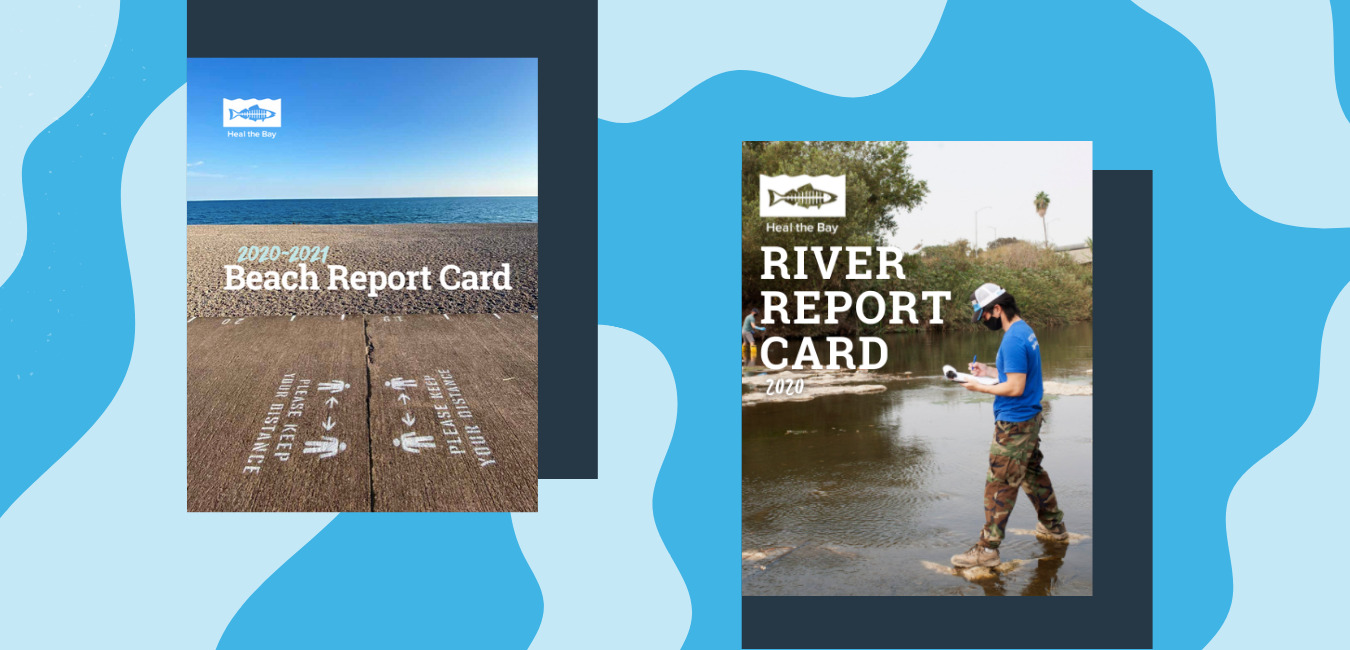
Heal the Bay releases scientific reports and annual bacterial-pollution rankings for hundreds of beaches in California and dozens of freshwater recreation areas in Los Angeles County during 2020 – 2021.
The thirty-first annual Beach Report Card study assigns A-to-F letter grades for 500 California beaches based on levels of fecal-indicator bacterial pollution in the ocean measured by County health agencies. In addition, we ranked water quality at 28 freshwater recreation areas in Los Angeles County during summer 2020 and shared findings from the third annual River Report Card.
Highlights from the Beach Report Card
Hotter days are here! Beach days and river trips are at an all-time high. The good news is California beaches had excellent water quality in summer 2020. 93% of the California beaches monitored by Heal the Bay received an A or B grade, which is on par with the five-year average.
Even so, our scientists remain deeply concerned about ocean water quality. Polluted waters pose a significant health risk to millions of people in California. People who come in contact with water with a C grade or lower are at a greater risk of contracting illnesses such as stomach flu, ear infections, upper respiratory infections, and rashes.
Beaches and rivers usually have high-risk water quality following a rain event. Less rain typically means that reduced amounts of pollutants, including bacteria, are flushed through storm drains and rivers into the ocean. However, this wasn’t the case this past winter. Rainfall across coastal counties in California was 41 percent lower than the historical average. Yet only 57% of California beaches had good or excellent grades during wet weather, which was worse than average. The lower grades are in part due to the high percentage of “first flush” samples in the wet weather dataset.
“As a surfer, I have spent a ton of time in the water since I was a little kid. The water quality at my local beaches is something I have always been observant of. Unfortunately there have been many times where the water quality has seemed very low and I’ve gotten sick from surfing in dirty water. I’m thrilled the World Surf League is partnering with Heal The Bay on the Beach Report Card for California. Everyone deserves access to clean water to surf, swim, and enjoy this precious resource – our one ocean!” –Conner Coffin
Read Beach Report Card summary en Español
California’s Beach Bummer List
Heal the Bay’s Beach Bummer List ranks the most polluted beaches in California based on levels of harmful bacteria in the ocean. The 2020-2021 Beach Bummer List includes beaches in San Diego, San Mateo, Santa Barbara, Los Angeles, Humboldt, and Santa Cruz Counties.
- Tijuana Slough National Wildlife Refuge, Tijuana River mouth – San Diego County
- Foster City, Erckenbrack Park – San Mateo County
- Capitola Beach, west of jetty – Santa Cruz County
- Foster City, Gull Park – San Mateo County
- Marina del Rey Mother’s Beach, between Lifeguard Tower and Boat dock – Los Angeles County
- Tijuana Slough National Wildlife Refuge, 3/4 miles north of Tijuana River – San Diego County
- Clam Beach County Park at Strawberry Creek – Humboldt County
- Foster City, Marlin Park – San Mateo County
- Candlestick Point, Windsurfer Circle – San Francisco County
- East Beach at Mission Creek – Santa Barbara County
California’s Beach Honor Roll List
Heal the Bay’s Honor Roll List includes 35 California beaches that scored perfect water quality grades year-round (compared to 42 beaches in the prior year). Most beaches on the Honor Roll are in Southern California because many Counties in Central California and Northern California do not sample frequently enough during the winter months. Orange County had the most beaches on the Honor Roll. Los Angeles, Ventura, San Luis Obispo, San Diego, San Francisco, Santa Barbara, and Alameda Counties also had beaches with perfect water quality grades.
- Crown Beach, at Sunset Rd. – Alameda County
- Royal Palms State Beach – Los Angeles County
- Leo Carrillo Beach, at Arroyo Sequit Creek – Los Angeles County
- Puerco State Beach, at creek mouth – Los Angeles County
- Las Flores State Beach, at Las Flores Creek – Los Angeles County
- Broad Beach, at Trancas Creek – Los Angeles County
- Escondido State Beach, at Escondido Creek – Los Angeles County
- Nicholas Beach, at San Nicholas Canyon Creek – Los Angeles County
- Newport Bay, Promontory Point – Orange County
- Crystal Cove (CSDOC) – Orange County
- Newport Beach, at Orange Street – Orange County
- Newport Beach, at 52nd/53rd Street – Orange County
- Balboa Beach Pier – Orange County
- Balboa Beach, The Wedge – Orange County
- Crystal Cove – Orange County
- 1000 Steps Beach, at 9th St. – Orange County
- North Aliso County Beach – Orange County
- Treasure Island Beach – Orange County
- Carlsbad, at Encina Creek – San Diego County
- Carlsbad, at Palomar Airport Rd. San Diego County
- Solana Beach, Tide Beach Park at Solana Vista Dr. – San Diego County
- Guadalupe Dunes – Santa Barbara County
- El Capitan State Beach – Santa Barbara County
- China Beach, at Sea Cliff Ave. – San Francisco County
- Ocean Beach, at Lincoln Way – San Francisco County
- Sewers at Silver Shoals Dr. – San Luis Obispo County
- Morro Bay City Beach, at Atascadero – San Luis Obispo County
- Pismo State Beach, 330 yards north of Pier Ave. – San Luis Obispo County
- Hollywood Beach, at Los Robles St. – Ventura County
- C.I. Harbor, at Hobie Beach Lakeshore Dr. – Ventura County
- Oil Piers Beach, south of storm drain – Ventura County
- Silverstrand, at Sawtelle Ave. – Ventura County
- Ormond Beach, 50 yards north of Oxnard Industrial drain – Ventura County
- Ormond Beach, at Arnold Rd. – Ventura County
- Faria County Park, at stairs – Ventura County
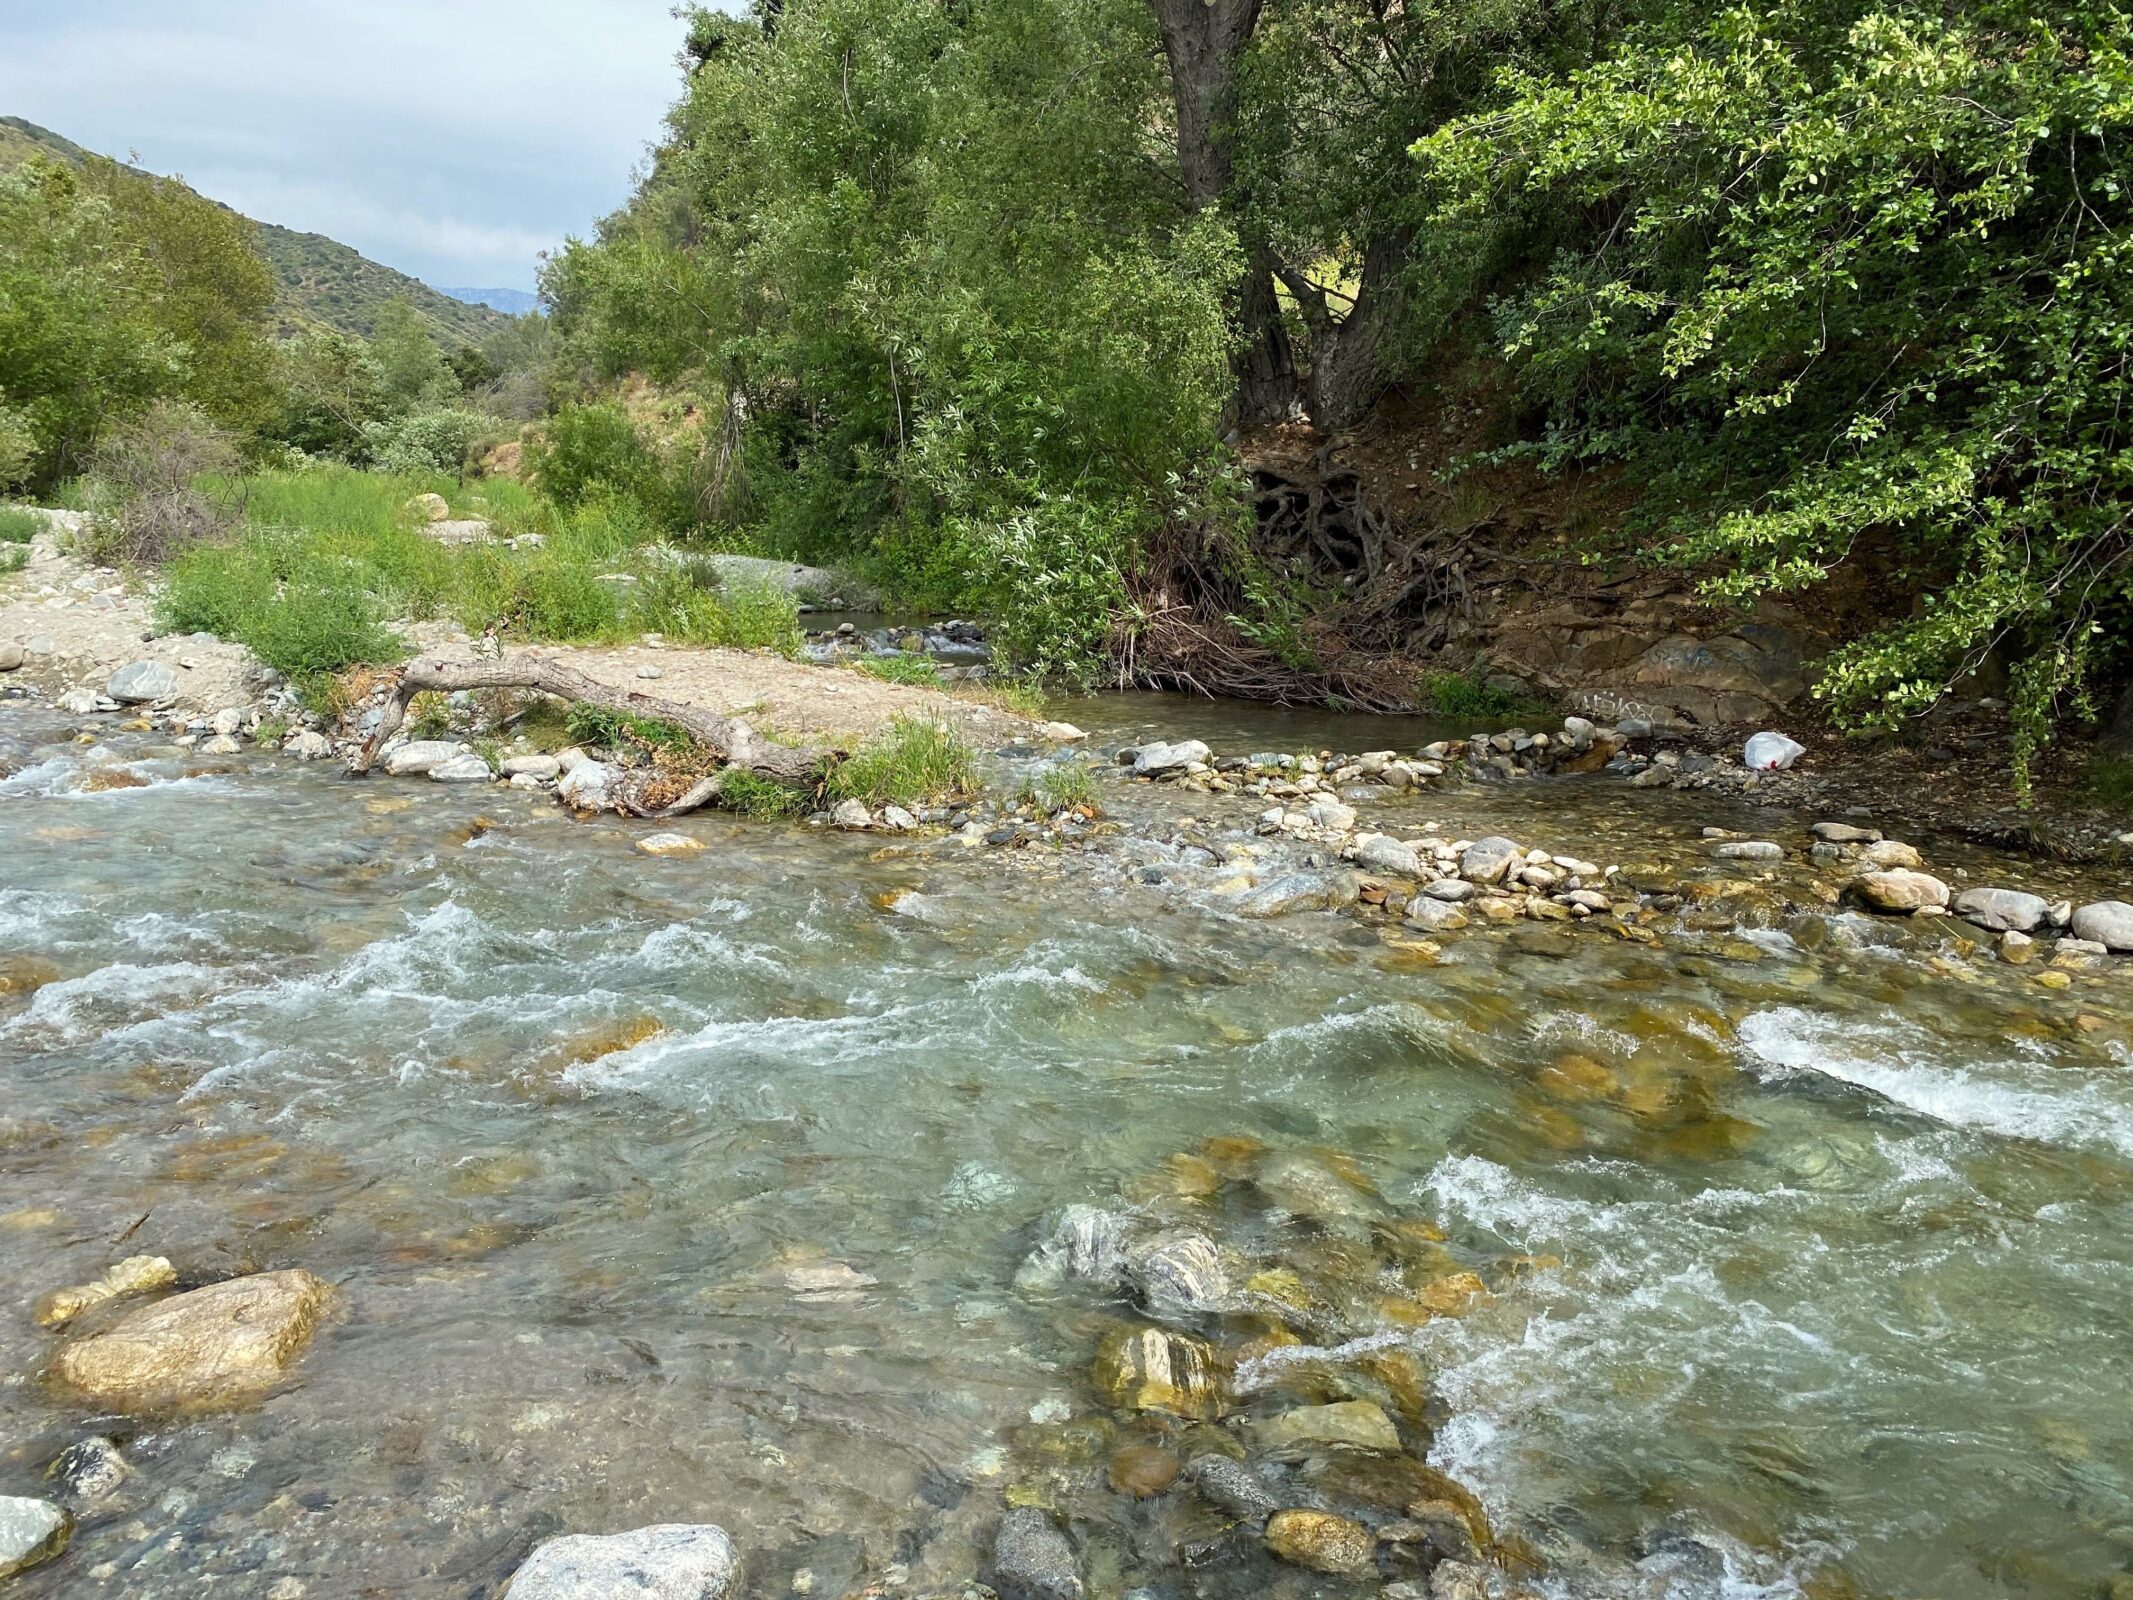
Highlights from the River Report Card
Heal the Bay graded 28 freshwater recreation areas in Los Angeles County within the L.A. River, San Gabriel River, and Malibu Creek Watersheds during summer 2020. 70% of the freshwater grades indicated a low risk of illness, 17% indicated a moderate risk of illness, and 13% indicated a high risk of illness.
Read River Report Card summary en Español
L.A.’s Freshwater Fails List
Top 9 river recreation sites in Los Angeles County that are high-risk places to swim or boat.
- 1. Tujunga Wash at Hansen Dam – Upper L.A. River Watershed
- 2. L.A. River at Rattlesnake Park – L.A. River Watershed: Recreation Zones
- 3. San Gabriel River Below North and West Forks – San Gabriel River Watershed
- 4. L.A. River at Middle of Sepulveda Basin Recreation Zone – L.A. River Watershed: Recreation Zones
- 5-6. Bull Creek – Upper L.A. River Watershed
- 5-6. Lake Balboa Boat Ramp – Upper L.A. River Watershed
- 7. Lake Balboa Outlet – Upper L.A. River Watershed
- 8. L.A. River at Balboa Blvd. – L.A. River Watershed: Recreation Zones
- 9. Switzer Falls – Upper L.A. River Watershed
L.A.’s Freshwater Honor Roll List
Top 10 river recreation sites in Los Angeles County that are low-risk places to swim or boat.
- 1-8. San Gabriel River East Fork at Graveyard Canyon – San Gabriel River Watershed
- 1-8. L.A. River at Benedict St. (formerly Frogspot) – L.A. River Watershed: Recreation Zones
- 1-8. Gould Mesa – Upper L.A. River Watershed
- 1-8. Hansen Dam Lake – Upper L.A. River Watershed
- 1-8. San Gabriel River Lower North Fork – San Gabriel River Watershed
- 1-8. Sturtevant Falls – Upper L.A. River Watershed
- 1-8. San Gabriel River Upper North Fork – San Gabriel River Watershed
- 1-8. Big Tujunga Creek at Vogel Flats – Upper L.A. River Watershed
- 8-10. San Gabriel River Upper East Fork – Upper L.A. River Watershed
- 8-10. San Gabriel River Upper West Fork – San Gabriel River Watershed
Equity and Access
The COVID-19 pandemic, a record-setting wildfire season, and extreme heat during summer 2020 highlighted the dire need for equity in our waters, and exposed major systemic failures; open spaces, including beaches and rivers, are not equally accessible to all people. Low-income communities of color tend to be the most burdened communities, bearing the brunt of environmental pollution and limited access to open space.
“A day at the beach and the river shouldn’t make anyone sick,” said Dr. Shelley Luce, President and CEO of Heal the Bay. “With the closures, stress, and uncertainty of the pandemic, it is no surprise that people sought out our local waters in 2020. While we’re thrilled about the excellent water quality across California, our marine ecosystems are still threatened by climate change and other pollution sources. This is alarming as we expect people to increasingly seek out ocean shorelines and freshwater swimming holes to cool off as temperatures rise. Heal the Bay’s Beach Report Card and River Report Card give access to the latest water quality information and are a critical part of our science-based advocacy work in support of strong environmental and public health policies that improve the health and resilience of our ocean, our rivers, and our communities.”
Tips to stay safe at ocean and freshwater areas
- View beachreportcard.org and healthebay.org/riverreportcard for the latest water quality information.
- Avoid shallow, enclosed beaches and freshwater areas with poor water circulation.
- Swim at least 100 yards away from flowing storm drains, creeks, and piers.
- Stay out of the water for at least 72-hours after a rain event.
- Follow all local health and safety regulations, including all local pandemic-related regulations.
- Check in with the lifeguard or ranger on duty for more information about the best places to swim.
About Heal the Bay
Heal the Bay is a 501(c)3 nonprofit organization founded in 1985. We use science, education, community action, and advocacy to fulfill our mission to protect coastal waters and watersheds in Southern California. Heal the Bay Aquarium, located at the Santa Monica Pier, welcomes 100,000 guests annually and hosts a variety of public programs and events that highlight local environmental issues and solutions. Learn more at healthebay.org and follow @healthebay on social media.
About Beach Report Card
Beach Report Card with NowCast, in partnership with World Surf League, is Heal the Bay’s flagship scientific water quality monitoring program that started in the 1990s. For thirty years, the Beach Report Card has influenced the improvement of water quality by increasing monitoring efforts and helping to enact strong environmental and public health policies. Learn more at beachreportcard.org and download the free app on iPhone and Android devices.
The Beach Report Card is made possible in part through generous support from SIMA Environmental Fund, Swain Barber Foundation, SONY Pictures Entertainment, and World Surf League.
About River Report Card
Currently, there is no statewide water quality monitoring mandate for rivers and streams in California, like we have for the ocean as a result of the Beach Report Card. Heal the Bay started the River Report Card in 2017 to push for new public health protections for freshwater areas in addition to serving the immediate need for increased public awareness about the risks at popular freshwater recreation areas in Los Angeles County. Learn more at healthebay.org/riverreportcard.
The River Report Card is made possible in part by generous support from Alice C. Tyler Perpetual Trust and Garfield Foundation.
Media inquiries only please: Contact us
The Beach Report Card is made in partnership with World Surf League.
![]()
View the Beach Report Card and River Report Card from last year.