

Looking for more than water quality? Find more Ash to Action Updates HERE.
SEE OUR THE LATEST POST-FIRE WATER QUALITY UPDATES:
April 10, 2025
Post-fire ocean advisories were just lifted, but is it finally safe to swim in the coastal waters?
March 27, 2025
Heal the Bay’s post-fire water quality data and analysis is live!
March 25, 2025
Watch the Webinar on the most recent Ash to Action updates
March 13, 2025
Read our analysis of the LACDPH & RWQCB data (part 2).
February 28, 2025
Our analysis of the LA County Department of Public Health post-fire water quality data is live.
February 26, 2025 –
Learn about beach safety in the wake of the fires.
February 18, 2025
In late January, Heal the Bay’s staff scientists began collecting ocean-water samples from 10 shoreline sites along the Bay to test for heavy metals, PCBs, asbestos, and other toxins. See our water quality testing timeline
January 29, 2025
Our fire response has just begun.
UPDATE APRIL 10, 2025
The ocean water advisories along LA’s coast have been lifted, and based on recent data, Heal the Bay is cautiously optimistic that chemical contamination from the fires no longer poses a major risk for beachgoers. Post-fire debris is still a danger.
Is it finally safe to swim and surf? This week the Los Angeles County Department of Public Health lifted the ocean water advisories along LA’s coast. Based on data collected in January and February, Heal the Bay is cautiously optimistic that the chemical contamination from the fires does not pose a significant risk for recreation at our local beaches or in our coastal waters. However, the burn area may still pose some risks to beachgoers, swimmers, and surfers. Here’s what we know:- Avoid areas within 250 yards of active debris removal.
- Wear closed-toe shoes if walking on wet sand, as debris such as broken glass and structural fragments may still wash ashore.
- Never touch trash or debris with bare hands.
- Keep children and pets away from debris, especially in wet sand or high tide areas, where contamination risk may be higher.
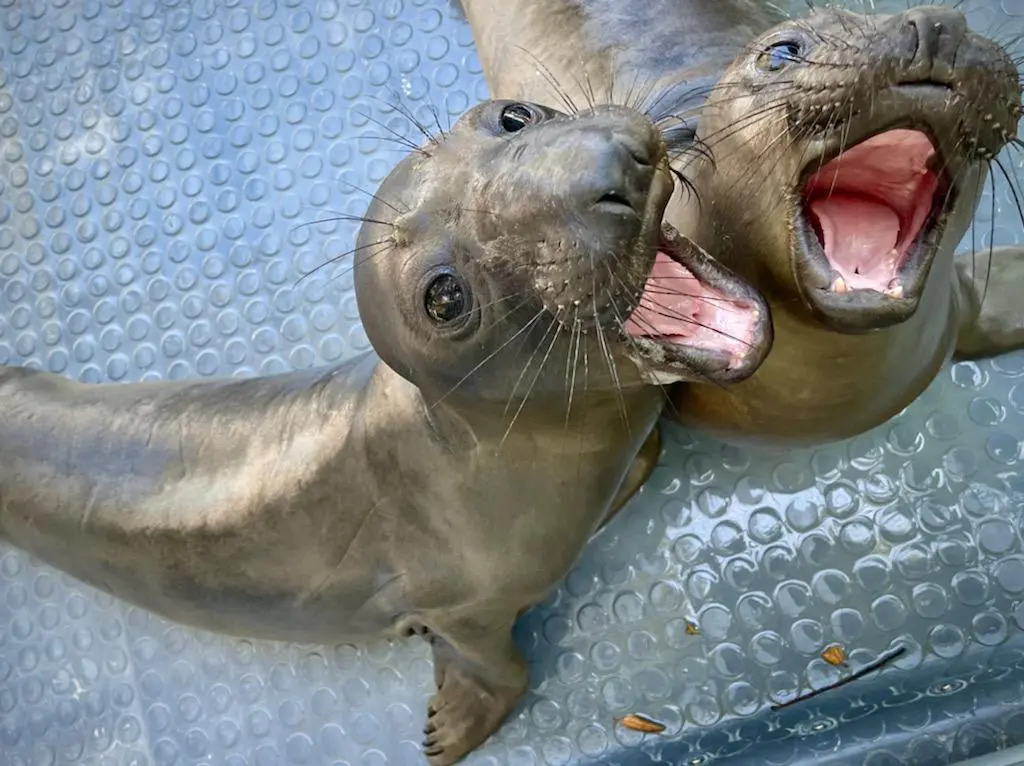
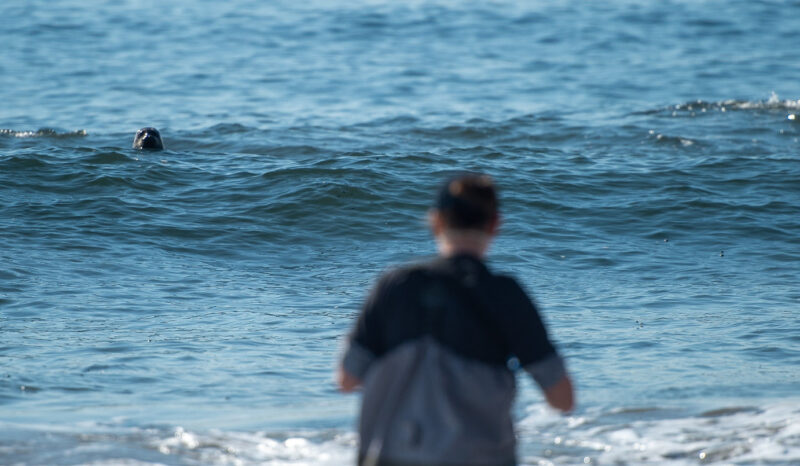
- Do not approach injured or distressed wildlife. If you have concerns about a marine mammal, contact the Marine Mammal Care Center at (1-800-39-WHALE).
- Heal the Bay continues to urge beachgoers to recreate south of Santa Monica at Montana Avenue or north of the fire boundary in Malibu, where impacts are significantly lower.
- Avoid eating seafood caught in Santa Monica Bay. Contaminants in the ocean water exceed safe levels for fish consumption. Additionally, the SoCal coast is experiencing a harmful algal bloom, which may pose a risk when consuming locally caught shellfish.
UPDATE MARCH 27, 2025
**New data has become available since March 27. An update is coming soon.
According to water-quality testing results released today by Heal the Bay, local marine life faces significant and ongoing threats from heavy metals that leached into Santa Monica Bay after January’s Palisades wildfires.
PRESS RELEASE 3/27/2025 –Test results from 10 collection sites along the entire length of Santa Monica Bay show that immediately after the fires, water quality at LA’s beaches was much better than expected, diminishing fears about human health impacts from polluted runoff in fire-scarred areas. We cannot definitively say that the water is safe until we have additional data and information about risk-thresholds for recreational contact, but based on the data we have seen to date, we are cautiously optimistic.
However, our analysis indicates that marine mammals, multiple fish populations, and other species further down the food chain are at serious risk from elevated levels of beryllium, copper, chromium, nickel, lead, and other harmful heavy metals and nutrients.

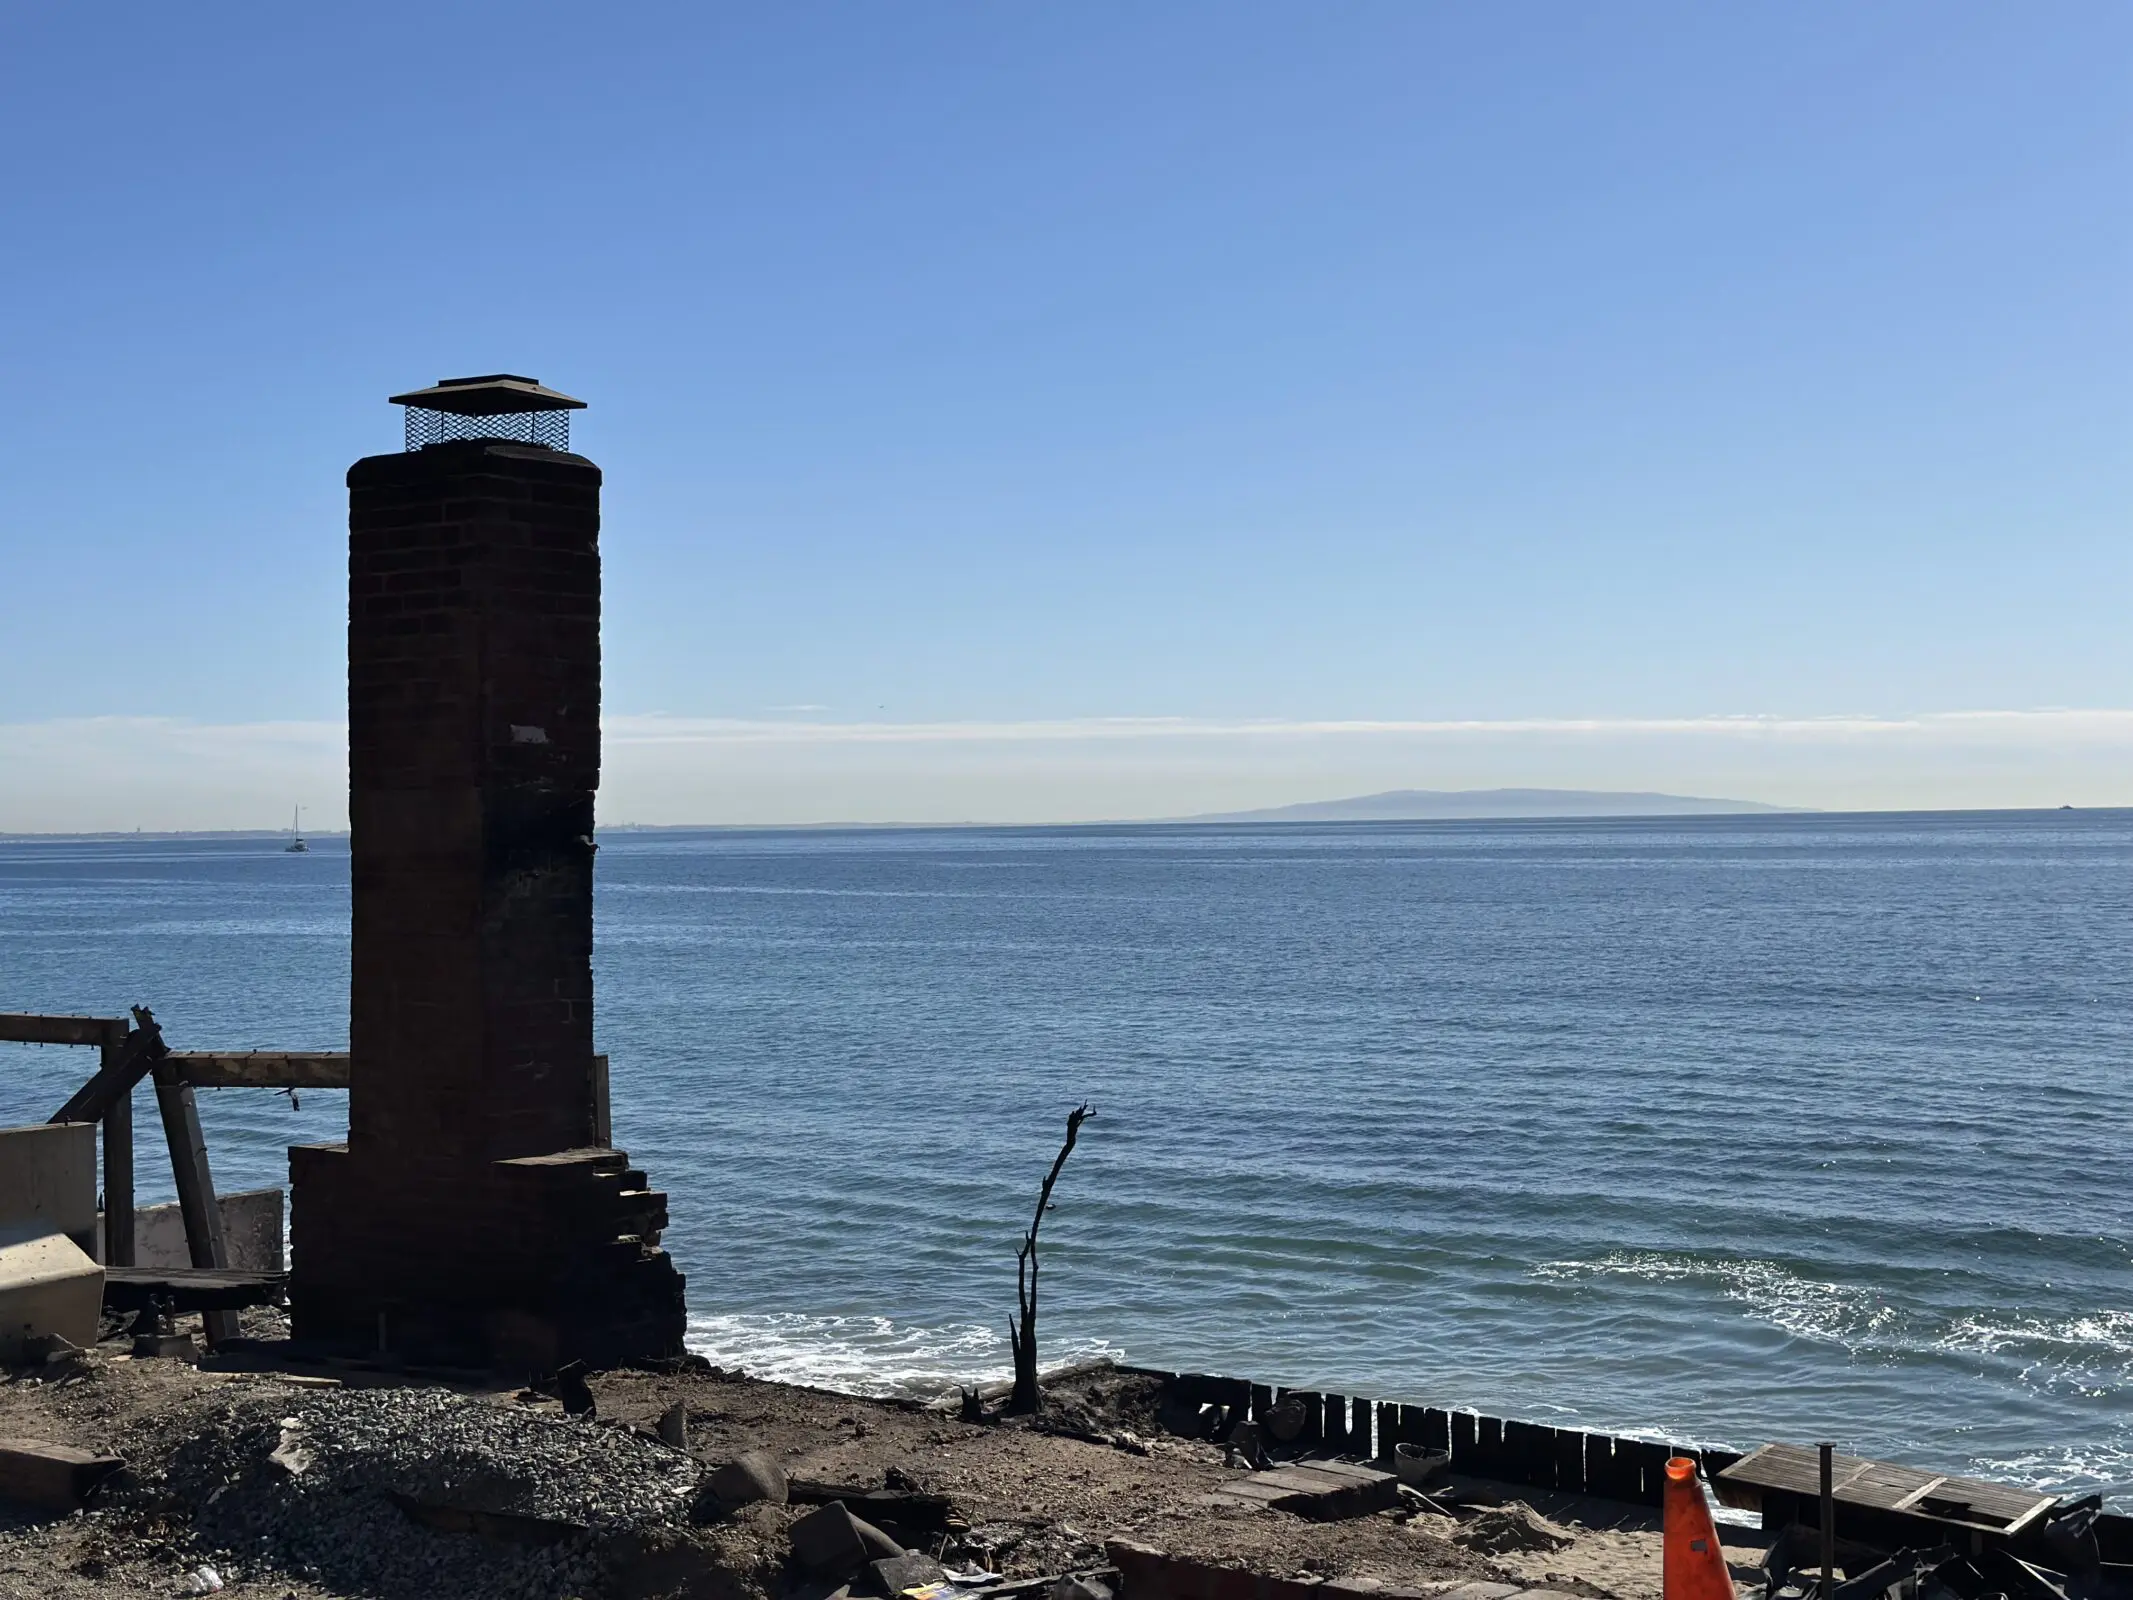
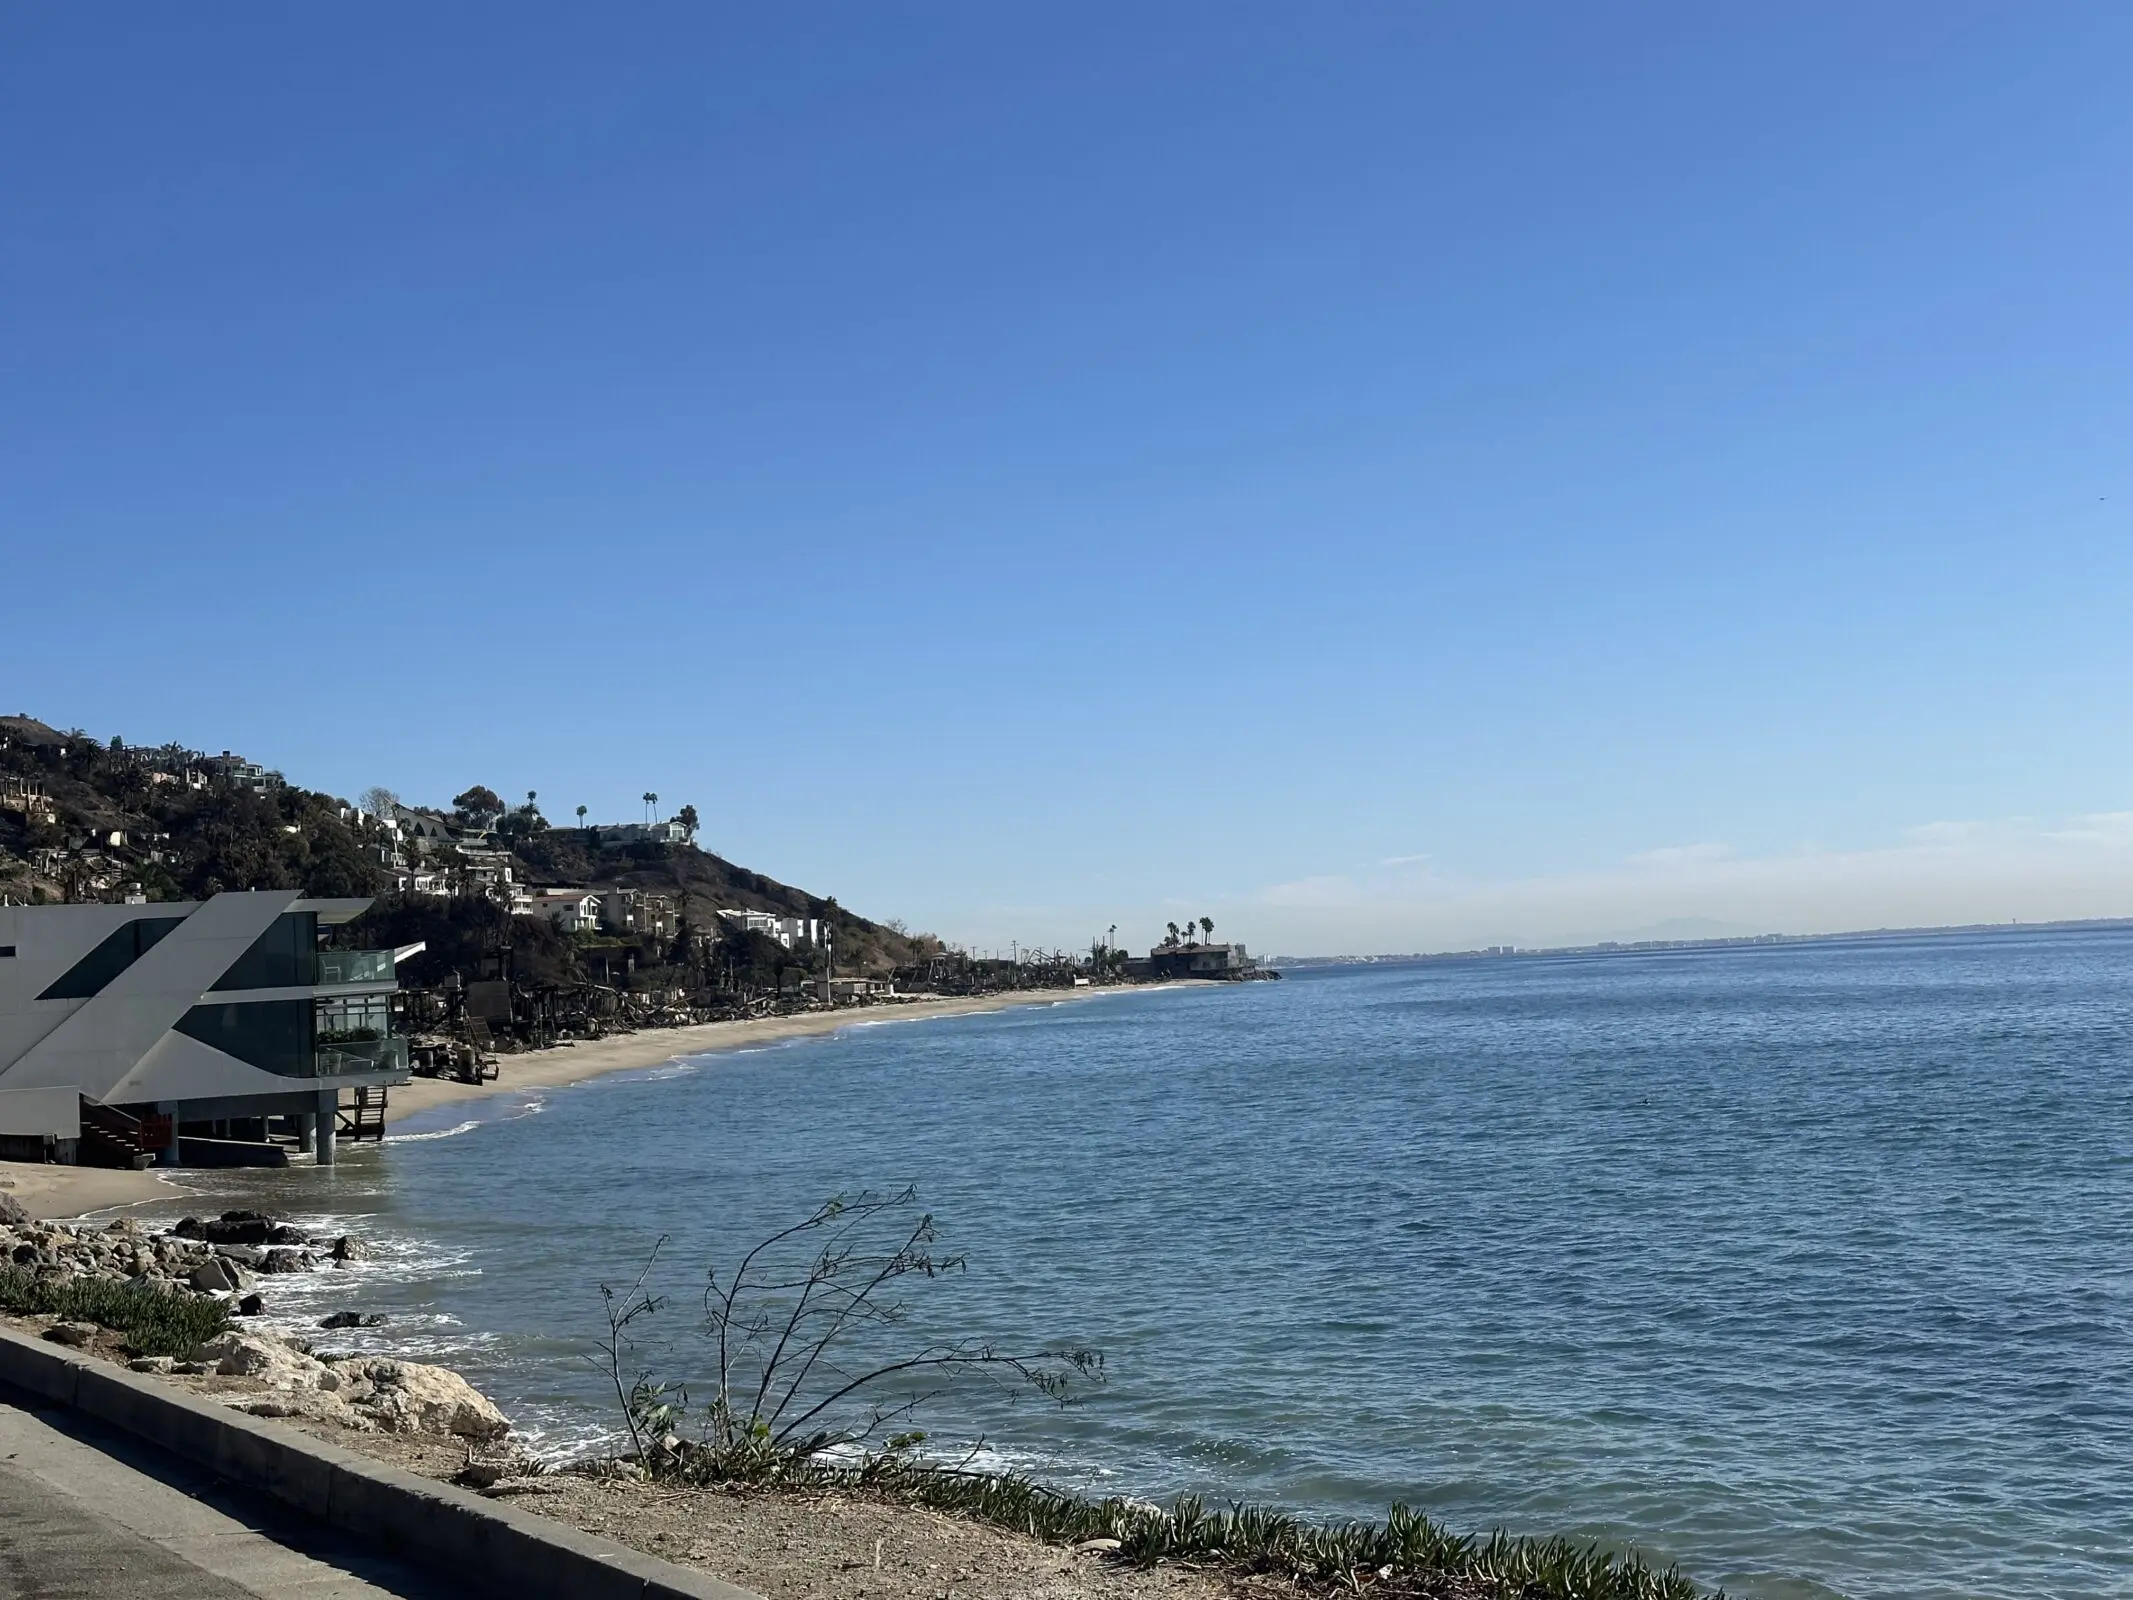
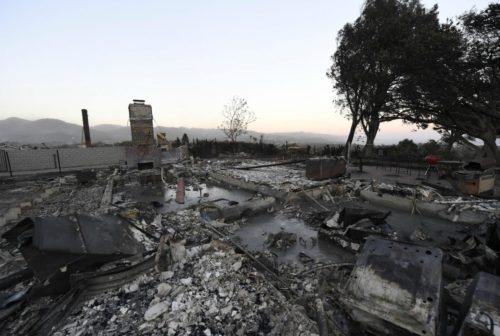
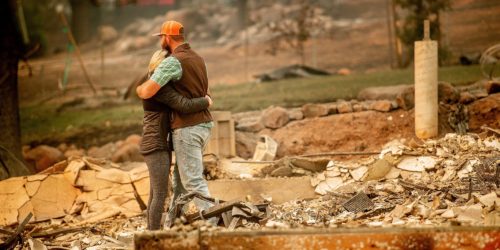
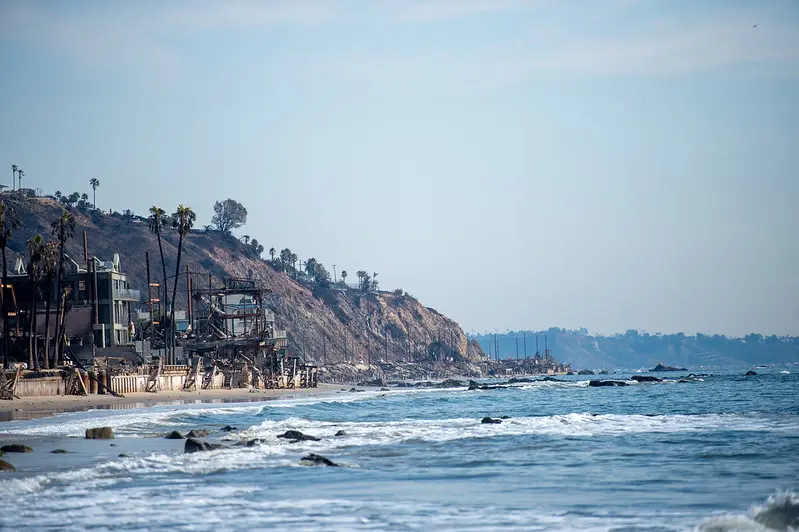
Following heavy seasonal rains, toxic pollutants washed into the intertidal zones from burned structures and scorched earth in the Palisades, Topanga, and Malibu. Waves lapping onto fire-ravaged buildings along Pacific Coast Highway continue to sweep harmful metals into the sea.
Even at low concentrations, heavy metals can disrupt vital biological processes, damage cells, and impair reproductive and immune functions for marine life. Metals can also be transferred and magnified through the food chain. This impacts the entire food web, which inevitably impacts humans. In short, when animals get sick, humans can get sick, particularly from consuming seafood that has a bioaccumulation of metals in their systems.
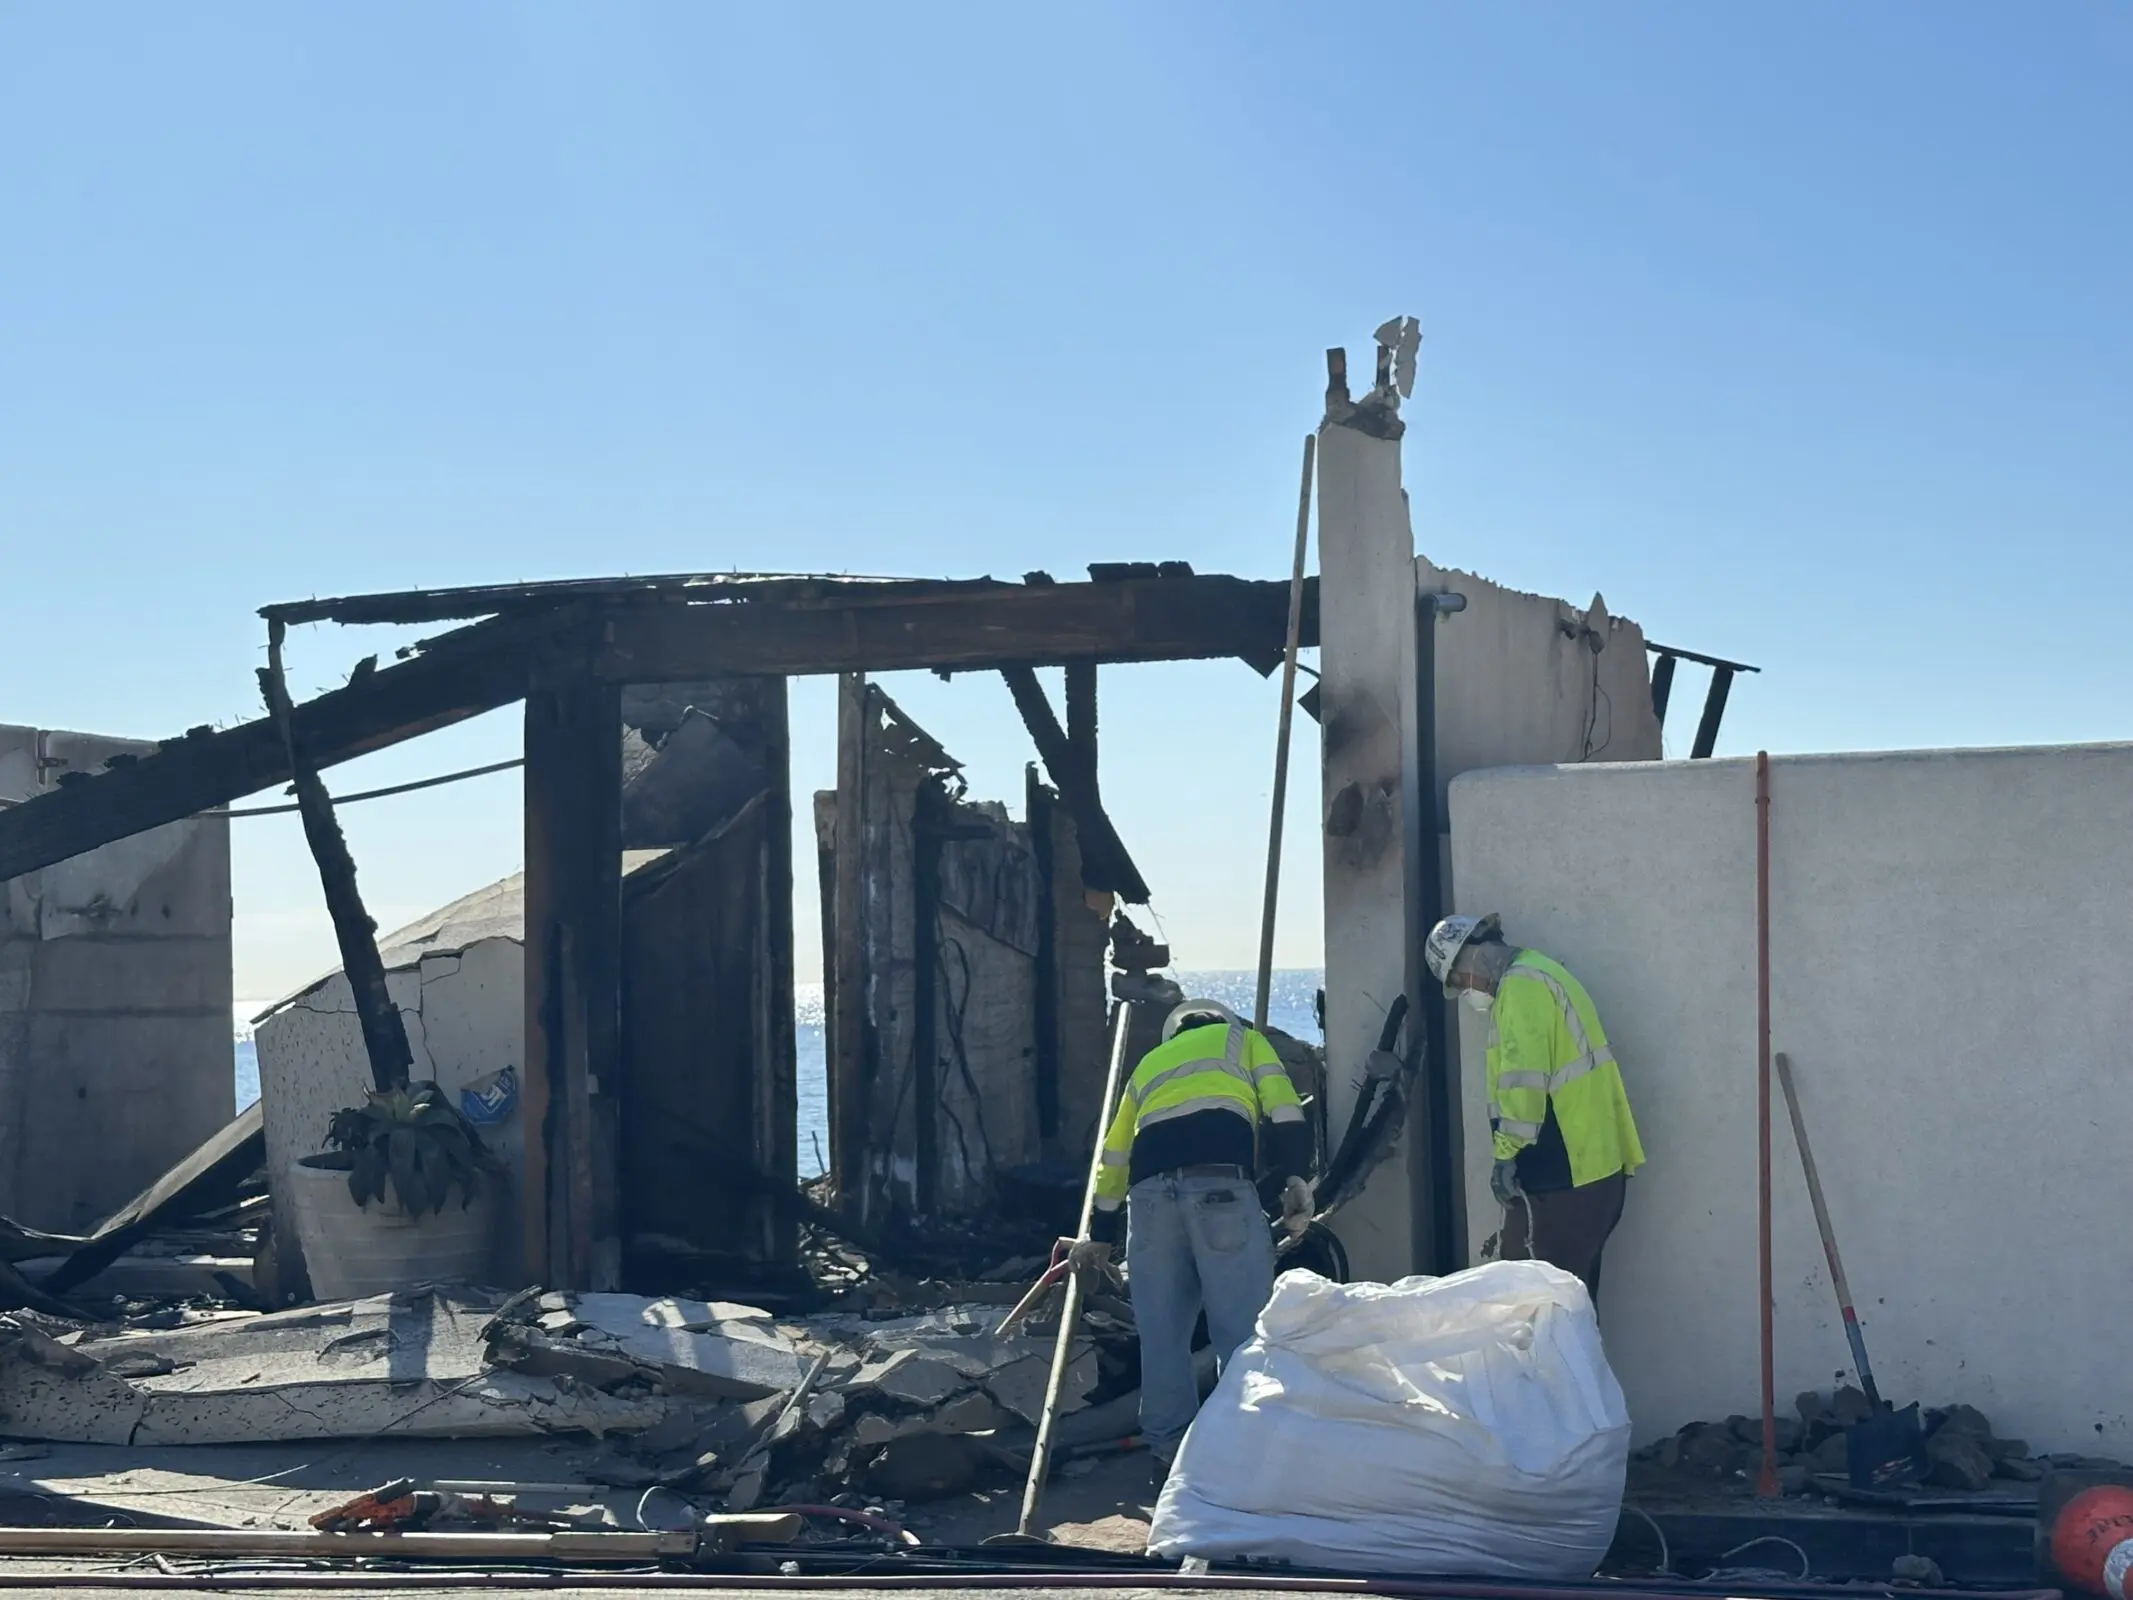
Heal the Bay is urging authorities to expedite the removal of burned-out structures and other fire-related debris from PCH as soon as possible. Unfortunately, some homeowners have been slow to respond to U.S. Army Corps of Engineers’ offers to facilitate debris removal. Roughly 45 shoreline homeowners have opted out of the program, while nearly 100 have not responded at all. Whether or not a homeowner decides to use the US Army Corps of Engineers or a private contractor, it’s imperative that debris removal happens quickly.
“Every day that hazardous debris remains along the coast, more harmful contaminants flow into the sea,” says Tracy Quinn, President and CEO of Heal the Bay. “If we want to give our marine life a fighting chance, we need that debris removed as soon as possible.”

The most concerning findings come from the hardest-hit fire areas, including Topanga Beach, the Big Rock section of Malibu, and Will Rogers State Beach near Pacific Palisades. However, the waters around Santa Monica Pier and Dockweiler State Beach also spiked for heavy metals — suggesting that more studies are needed to understand the movement of contaminants offshore or identify other sources.
Because it is now March, these data do not tell us the current conditions in Santa Monica Bay, but they do provide valuable insight into the impacts of the Palisades Fire on marine life and the potential impacts on human health.
Risk tolerance is a personal decision. Here is some information that can help beachgoers decide if, when, and where they may want to enter the ocean.
- The contaminants tested seem to be below human health limits for recreational contact for the data where limits could be identified. The Los Angeles Regional Water Quality Control Board is still assessing risk-thresholds, including those for PAH, a harmful organic compound related to fire-scorched debris.
- PAHs, the group of contaminants that may be above human health limits, are unlikely to sicken people who swim or surf a few times, but frequent or prolonged exposure may contribute to an increased risk for future chronic health issues.
Beachgoers should also be careful about walking on the sand, which may contain sharp fire-related debris like nails and broken glass. For the time being, Heal the Bay recommends avoiding beaches within the fire-impacted areas and as far south as Montana Ave in Santa Monica. The Regional Water Quality Control Board has already posted some sand and sediment data for LA’s beaches. We are waiting for the complete test results to post our analysis. Stay tuned.
The fire and recent marine mammal deaths
It’s also worth noting the recent uptick in marine mammal beach stranding and deaths in Santa Monica Bay related to domoic acid poisoning. Elevated levels of runoff-related nutrients can contribute to the development of algal blooms in the Bay and accumulate in shellfish. When mammals consume shellfish, they can get sick and die from the neurotoxins produced by certain algae.
This is the fourth consecutive year of domoic acid outbreaks. The recent fires did create a significant dump of nutrients like sulfate and phosphorous into the ocean, but there is no evidence, yet, of a correlation between the wildfires and the domoic acid outbreak.
About the testing

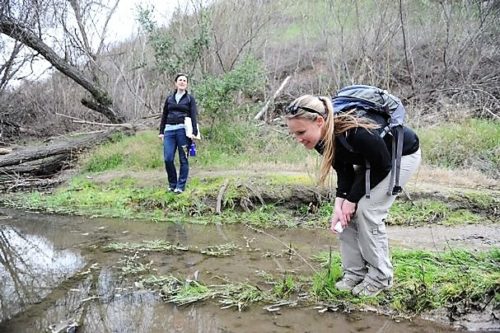
On Jan. 24-25, before the first winter storms came, Heal the Bay staff collected ocean-water samples at 10 shoreline sites across Santa Monica Bay. From Paradise Cove to Malaga Cove, they tested for 116 pollutants. They took samples again on Jan. 28, after heavy rainfall, to better understand how stormwater might carry toxins from the burn zone.
Processing samples took multiple weeks due to the complexity of sample preparation, the need for precise instrumentation, and the rigorous quality control required. It also took several weeks to receive the data results back from Physis Lab. Then, additional time was needed for Heal the Bay’s Science and Policy Team to analyze and assess the data.
Staff members from the Los Angeles County Department of Public Health collected water samples on Feb. 18, which Heal the Bay also analyzed for its report. After the intense Feb. 13 storms, testing showed elevated levels of contaminants that do not have established risk-thresholds for recreational contact. Further analysis is required and will be included in an upcoming post.
Heal the Bay is part of a collaborative task force working with government agencies, researchers, and other nonprofits to better understand the extent of the contamination and how to clean it up efficiently. We will be updating our analysis and sharing the findings in the weeks to come as soon as new data becomes available.
Heal the Bay is the only organization providing this kind of in-depth analysis of water quality data.
But to continue this important work, we need your support. If you’d like to see more of these efforts, please consider donating.
Every contribution helps!
UPDATE MARCH 25, 2025
Watch the Webinar for today’s latest Heal the Bay Ash to Action Updates.
Learn about the critical work that Heal the Bay and its academic partners are doing to protect the environment and monitor water quality in Santa Monica Bay.
UPDATE MARCH 13, 2025
The Los Angeles Regional Water Quality Control Board has released its 2025 Post-Fire Water Quality Monitoring results.

“The board has been working with Los Angeles County to monitor ocean water quality since Jan. 22, 2025. Samples are collected regularly at 12 beach sites from La Costa Beach to Dockweiler Beach by the Los Angeles County Department of Public Health. They then are analyzed by the board for metals, nutrients, polychlorinated biphenyls (PBCs) and polycyclic aromatic hydrocarbons (PAHs), which are chemicals that may be found in water runoff based on previous California wildfires.” (Waterboards.ca.gov)
Click here to SEE THEIR RESULTS, the test site map, and stay tuned for their sediment and beach sand sampling results.
UPDATE FEBRUARY 28, 2025
Post-Fire Water Quality in Santa Monica Bay: We reviewed results from the LA County Department of Public Health (DPH).
Recent wildfires in Los Angeles that started on January 07, 2025, have impacted water quality in Santa Monica Bay. To understand the extent of these water quality impacts, we looked for contaminants that are likely to be mobilized after a wildfire, and that pose a risk to human and ecological health when concentrations are elevated; this includes heavy metals, PAHs (polycyclic aromatic hydrocarbons), nutrients, bacteria, and solids that decrease water clarity. Right now, Heal the Bay has data that our staff collected for bacteria and water clarity (referred to as “turbidity”), which have faster processing times and which we can test on-site in the Heal the Bay lab, while other contaminant samples were sent to a contracted lab to process.
While we wait for Heal the Bay’s results for the other contaminants, we reviewed results from the LA County Department of Public Health (DPH), which took samples on January 22, 2025, and January 27, 2025, at beaches from Las Flores State Beach to Dockweiler State Beach. These data points are representative of water quality before and after the first flush rain event, over a month ago. Since then, we have had additional significant rainfall, including nearly two inches of rain on February 13, 2025, which, unfortunately, was not tested by DPH in time to provide wet weather data. Data that are more recent will provide needed insight into overall conditions in our coastal waters. Heal the Bay will continue to provide updates as new data become available.
Water contact limits do not exist for most of the contaminants of concern associated with wildfires, so to understand potential health risks, we compared results to limits in the CA Drinking Water standards, the CA Ocean Plan (for both human health and marine life), and the Hawai‘i Department of Health Surface Water Action Levels for Marine Habitats (used to assess impacts of the Lahaina Fires). Our initial findings show elevated heavy metals, bacteria, nutrients, and other organic compounds, along with a decline in water clarity, all of which indicate that wildfire runoff does pose a risk to human and ecological health and that contamination is traveling beyond the immediate burn zone.
Key Findings from January 22 and 27, 2025:
- Heavy Metals and Metalloids: Aluminum, iron, selenium, and manganese were elevated above drinking water standards, sometimes as much as 10x the limit. This is not an immediate human health threat, but we urge caution if there is the possibility of ingestion. These four metals, in addition to arsenic, copper, and zinc, also exceeded safety thresholds for marine health, particularly at Will Rogers State Beach and Topanga Beach, posing a health risk to marine life. Even at low concentrations, these metals can disrupt vital biological processes, damage cells, and impair reproductive and immune functions for marine animals.
- PAHs (polycyclic aromatic hydrocarbons): PAHs were detected at unsafe levels, based on human health standards in the CA Ocean Plan, at Will Rogers State Beach and Topanga Beach and were not detected at other sites. This poses a site-specific risk to human health within the burn zone.
- Nutrients: Elevated phosphorus levels have increased nutrient concentration in Santa Monica Bay, leading to the formation of a persistent brown foam along the shoreline and increasing the risk of algal blooms.
- Turbidity & Solids: While turbidity may not pose a direct risk to public health, it can disrupt biological processes for marine life, and water clarity can help to show how far runoff from the burn zone traveled along the coastline. Water clarity declined significantly after rain from Surfrider Beach down to at least Dockweiler Beach, indicating wildfire runoff spread beyond the burn zone. Turbidity levels were consistently good at Paradise Cove (north of the burn zone) and Malaga Cove (just north of Palos Verdes Peninsula), indicating boundaries on the extent of pollution traveling up and down the coastline, but that boundary is not yet clear.
- Bacterial Contamination: High bacteria levels were observed near storm drains, worsening after rainfall, following the typical pattern for bacterial pollution in Santa Monica Bay.
What You Need to Know:
A day at the beach should never make anyone sick. Heal the Bay is dedicated to protecting public health by sharing water quality information, and we remain concerned about the potential risks associated with post-fire contamination in ocean water and sand. Additionally, hazardous debris, such as nails and pipes, continues to wash ashore, posing a physical risk to beachgoers.
At this time, Heal the Bay recommends avoiding beaches and ocean water from Las Flores to Santa Monica State Beach and exercising caution at beaches further south, at least to Dockweiler State Beach. While water clarity does improve further south at Malaga Cove, we do not yet have comprehensive data for beaches south of Dockweiler State Beach, so we cannot determine potential health risks. If you visit the beach anywhere in Santa Monica Bay south of Surfrider Beach:
- Stay vigilant; look out for sharp debris and avoid picking up objects with bare hands.
- Keep children and pets from touching or ingesting water or wildfire debris.
- Refrain from full-body submersion into the coastal waters in the designated areas, which can lead to accidental ingestion.
Heal the Bay has collected additional sand and water samples throughout Santa Monica Bay from Paradise Cove down to Malaga Cove. We will share results on our website as soon as those data become available. We urge the Los Angeles County Department of Public Health to enhance transparency in decision-making and ensure all relevant data is made publicly accessible in a timely manner. Until further testing is completed and more information on current water conditions is released, we advise the public to remain cautious when visiting affected beaches.
UPDATE FEBRUARY 26, 2025
On Monday, February 24, 2025, Heal the Bay learned that the Los Angeles County Department of Public Health (DPH) had stated beachgoers may recreate on the sand in the fire-impacted areas. We also learned that this determination is likely based on only two debris samples taken by Los Angeles County Public Works, one at Topanga Creek and the other at Will Rogers State Beach. These samples were collected to determine the disposal method required to remove the debris, not to determine if it is safe for people to be on the sand. It is alarming that DPH would make this proclamation based on only two data points. While preliminary debris and ocean water quality testing have not shown elevated levels of harmful contaminants attributed to burned household items, the sample size for both water and sand thus far is quite small. At this time, we simply do not have enough information to determine if the sand or water at beaches where debris is present is safe for recreation. Furthermore, dangerous debris such as nails, screws, and pipes continue to wash up on shore, often concealed in sand or near-shore waves, increasing the risk to people playing on our beaches. This is an unprecedented event, and we must wait for the results of additional testing before declaring our beaches safe. We ask for increased transparency from the LA County Department of Public Health in decision making going forward, data used to protect our public health should be available to the public.
For now, Heal the Bay recommends that people avoid beaches (both sand and water) from Las Flores to Santa Monica State Beach and use extra caution on beaches south of Santa Monica. If choosing to go to the beach, watch out for sharp debris, do not pick up debris with your bare hands, and keep a close eye on children and pets to ensure they do not touch or ingest debris.
Heal the Bay and the Regional Water Quality Control Board have each collected sand samples from throughout the burn area, and we are awaiting results. We will share our ocean water and sand testing results on our website as soon as they are available.
Los Angeles County Department of Public Health’s full statement on beach safety: “The ocean water advisory due to fire impacts from Las Flores State Beach to Santa Monica State Beach remains in effect until further notice. Beachgoers may recreate on the sand but continue to be advised to stay away from visible fire debris and to stay out of the ocean water during any posted ocean advisory.”
UPDATE FEBRUARY 18, 2025
We expect results this week from Heal the Bay’s first round of expanded ocean-water quality testing.
In late January, Heal the Bay’s staff scientists began collecting ocean-water samples from 10 shoreline sites along the Bay to test for heavy metals, PCBs, asbestos, and other toxins. These harmful pollutants are flowing unchecked to the sea from recent heavy rains and other runoff from burn zones. We expect results from before and after the “first flush” storm during the week of February 17th and will post them here.
UPDATE JANUARY 14, 2025
We present the updated timeline detailing our recent water quality assessment activities in the coastal regions affected by the Palisades fire.
- January 24-25, 2025
-
- Heal the Bay conducted initial pre-rain water quality testing at 10 locations throughout Santa Monica Bay: five within the burn zone, three outside of the burn zone but within the beach advisory zones, and two control sites (one north and one south of the beach advisory zones).
- Our water quality scientists tested for temperature, turbidity, Fecal Indicator Bacteria, PAHs, PCBs, PFAS, benzene, mercury, and other heavy metals. This sampling involved coordination with the Fire Department and Lifeguards to gain access to the closed burn zone.
- January 28, 2025:
- After the January 26 rainstorm, staff took water quality samples again for the same pollutants and at the same locations tested on January 24-25, to compare pre- and post-rain results.
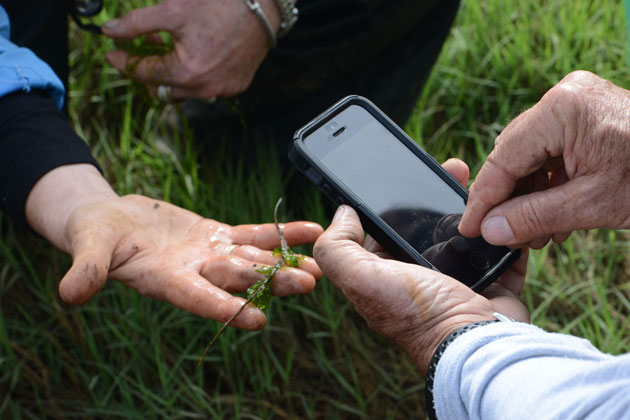
- Jenny Jay from UCLA joined us for the six northernmost sampling sites to test for metals, antibiotic-resistant bacteria, and nutrients.
- February 3, 2025:
- Heal the Bay staff examined the Beach Report Card on Friday, January 31, 2025, and identified data gaps within the burn zone.
- Staff went out on Monday, February 3, 2025, to sample the five locations within the burn zone for temperature, turbidity, and Fecal Indicator Bacteria (which we can process ourselves in our lab) to fill those data gaps.
- On this sample day, journalists from NPR and Spectrum News and the Fire Department’s photography team joined us to document and report on our testing.
- Heal the Bay staff attended the Post-Fire Coordinated Water Quality Testing Meeting hosted by SCCWRP. While this group aims to establish a working group to coordinate long-term post-fire water quality monitoring (which Heal the Bay will participate in), this meeting addressed urgent needs arising from the weather conditions by identifying who would be conducting sampling that week, where the sampling would occur, and which contaminants would be tested.
- February 10, 2025:
- Heal the Bay returned to the field one last time to support ongoing research, visiting six of our ten original sample sites, from Surfrider Beach at Malibu Lagoon to Will Rogers State Beach at Santa Monica Canyon.
- An assessment of the BRC on Friday, February 7, 2025, indicated no remaining data gaps, so we did not collect Fecal Indicator Bacteria samples.
- Instead, this trip was intended to gain access to the burn zone one more time and show our sampling locations to researchers from the Proteocean Lab at USC. They plan to build on our initial testing with weekly sampling for heavy metals, microbial health, and nutrients.
- Staff from Surfrider also joined us so that we could show them where there is safe access to their regular testing locations within the burn zone.
- We also collected sand samples at each site from below the high tide line and above the high tide line where the sand was dry (where possible). These samples have been delivered to CSU Northridge, where researchers will test them for heavy metals and PAHs. They will also compare the results from our sand samples to soil samples that they collected within the Eaton Fire burn zone.
UPDATE JANUARY 29, 2025
Our fire response has just begun.
Over the past six days, the Heal the Bay Science and Policy Team has been testing water in and out of the burn zones along Santa Monica Bay impacted by the Palisades Fire.
The Palisade Fire has increased sedimentation and introduced harmful pollutants into our coastal waters, and Heal the Bay is dedicated to understanding the impacts, which is why we are testing for key pollutants that may be transported into Santa Monica Bay due to runoff from the Palisade Fire.
Not only are we testing for bacteria and turbidity (which we can process in-house), but we are also collecting samples to test for Heavy metals, Mercury, PAHs/PCBs, Benzene, and PFOS/PFOA (two types of PFAS). We collected samples before and after the rain event on January 26, 2025, which will provide a comparative analysis of initial pollutant levels and stormwater runoff effects.

During a typical rain event, stormwater runoff is considered the most significant source of water pollution. Following the unprecedented wildfires in Los Angeles this past weekend, the “first flush” amplified the pollution – carrying not only higher levels of typical pollutants like oil and grease, trash, plastic, bacteria, and heavy metals but also wildfire debris and other hazardous materials including ash, fire suppressant, household chemicals, car batteries, and more. These contaminants pose significant risks to water quality, marine ecosystems, and public health.

The team collected water samples from 10 key locations, including areas within the burn zone, adjacent impacted areas, and control sites.

(NOTE: We were joined in the field by Professor Jennifer Jay of UCLA, and there may be additional data from agency offices like the LA County Department of Public Health, that will also contribute to the very limited water quality dataset for understanding the impacts of the Palisades Fire.)
Heal the Bay is one of only a few organizations doing this water quality testing in the wake of these devastating fires. Still, great science is collaborative, and our team is excited to be one of the only nonprofits contributing to this initial and limited data set. Every bit of data will help us understand the long-term impacts of this unprecedented fire season.
Our findings will be shared as soon as possible to inform the public about potential environmental and public health risks. We will also contribute to coordinated monitoring efforts that will inform policymakers and guide future mitigation and response efforts.
While our samples are being processed to help us understand what is in our coastal waters, we strongly urge everyone to avoid contact with ocean water and to refrain from walking on the beach, as fire debris runoff may contain toxic or carcinogenic chemicals. The LA County Department of Public Health has issued Ocean Water Closures from Las Flores State Beach to Santa Monica State Beach, with additional Beach Advisories issued as far north as Surfrider Beach at Malibu Lagoon and south to Dockweiler State Beach at World Way, all of which will remain in effect until further notice. Your health and safety are our top priority—thank you for doing your part to protect yourself and our environment.


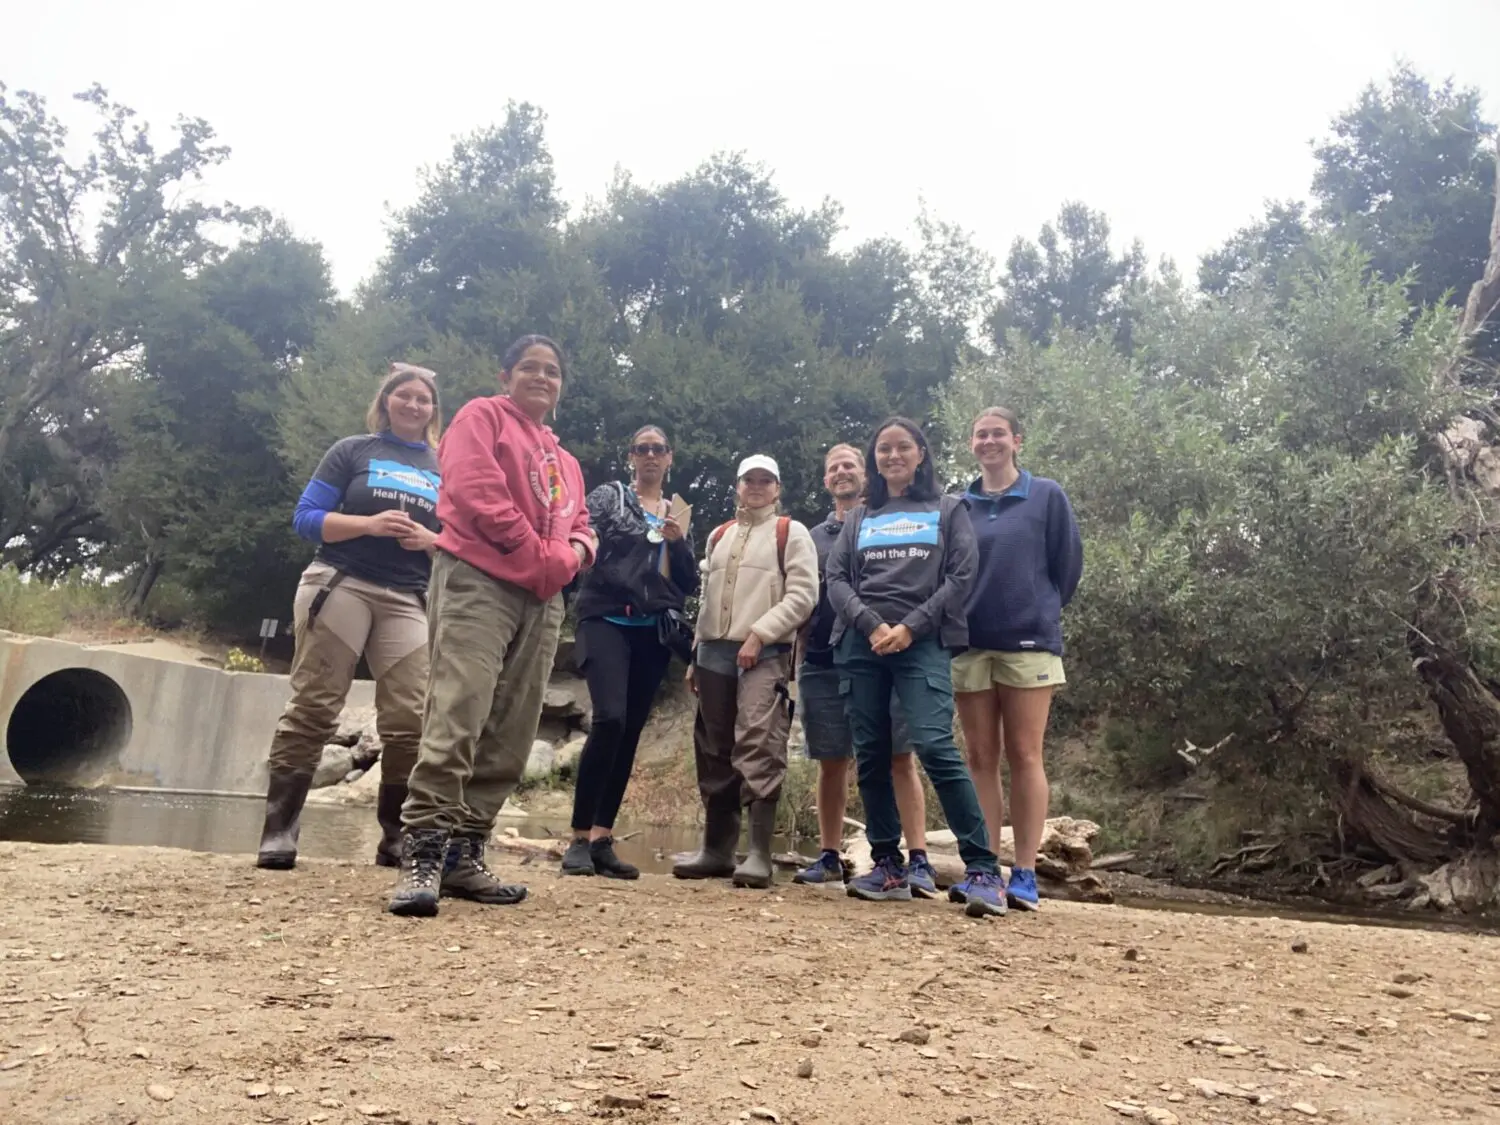
There are so many people to thank for making this work happen, but we will start with a huge thanks to Dan Murphy of the LA Fire Department for helping coordinate access to the burn zone, Los Angeles County Lifeguards and to our Heal the Bay sampling team (Dr. Tania Pineda-Enriquez PhD, Annelisa Moe, Naomi Meurice, Zoë Collins, and Vicente Villaseñor).
Key Terms:
PAHs = polycyclic aromatic hydrocarbons, volatile organic compounds associated with oil/grease
PCBs = Polychlorinated biphenyls, chemicals used in industrial / commercial products (PCBs stopped being produced in the 70s, so a legacy chemical)
PFASs = Per- and polyfluoroalkyl substances, forever chemicals (manmade chemicals that do not breakdown ) used to make waterproof, nonstick, and flame-resistant products.