2016-2017 Beach Bummer List

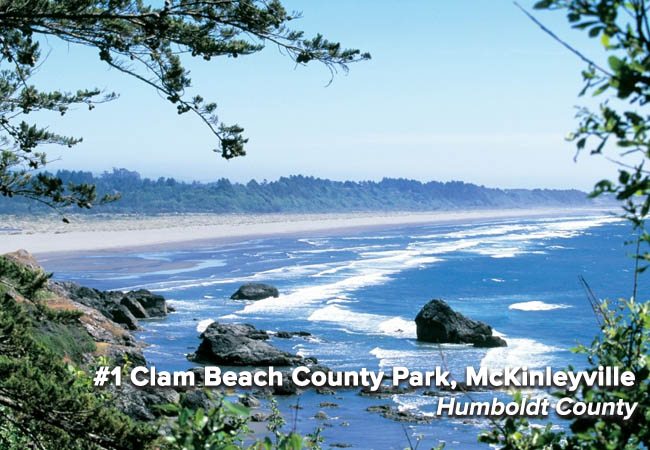
001-intro-slide 010-monarch-beach-beach-bummer-2017 009-mothers-beach-beach-bummer-2017 008-luffenholtz-beach-beach-bummer-2017 007-capitola-beach-beach-bummer-2017 006-santa-monica-pier-beach-bummer-2017 005-la-jolla-cove-beach-bummer-2017 004-lakeshore-park-beach-bummer-2017 003-cowell-beach-beach-bummer-2017 002-san-clemente-pier-beach-bummer-2017 001-clam-beach-beach-bummer-2017
<
>
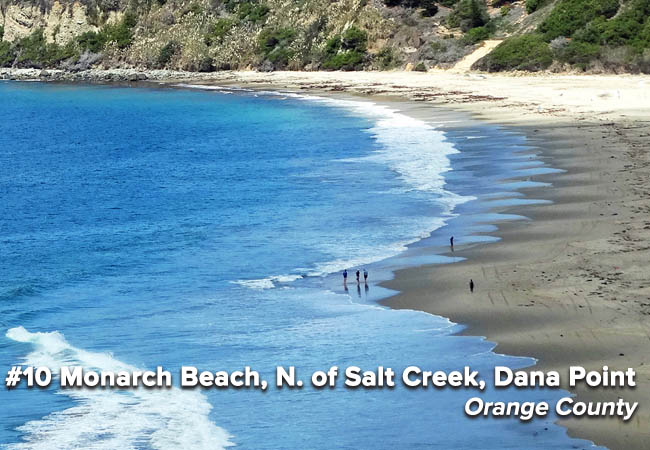
This site is right in front of the luxurious five-star Ritz Carlton resort in Dana Point, but one-star water quality persists in the bird-ridden spot. Local agencies have argued that the meandering portion of Salt Creek has facilitated a greater bird population, and in turn increased the amount of bird feces at this location—ultimately leading to the poor water quality. A falconry program was implemented to reduce bird-related bacterial counts at the mouth of the creek. However, potential harm to federally threatened snowy plovers during their nesting season halted the program—a decision Heal the Bay supported. The City of Dana Point has also invested in an Ozone Treatment Facility to treat dry weather runoff.

Heal the Bay analysts assigned A-to-F letter grades to 416 beaches along the California coast for three reporting periods in 2016-2017, based on levels of weekly bacterial pollution. Some 96% of beaches received A or B grades during the summer.

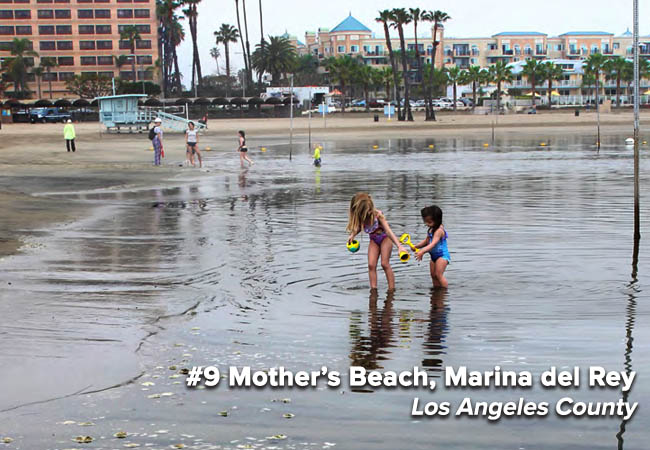
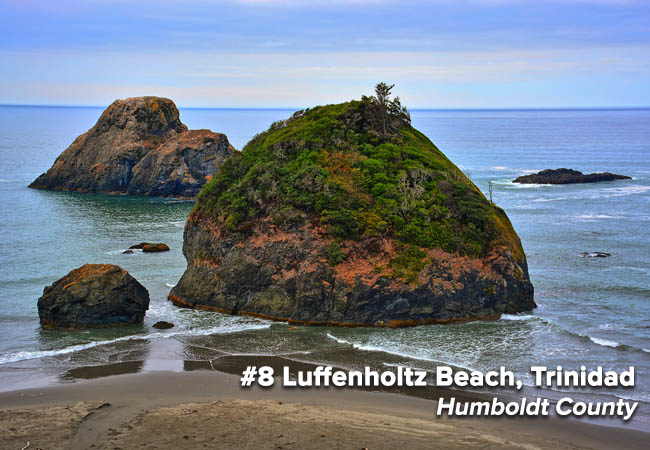
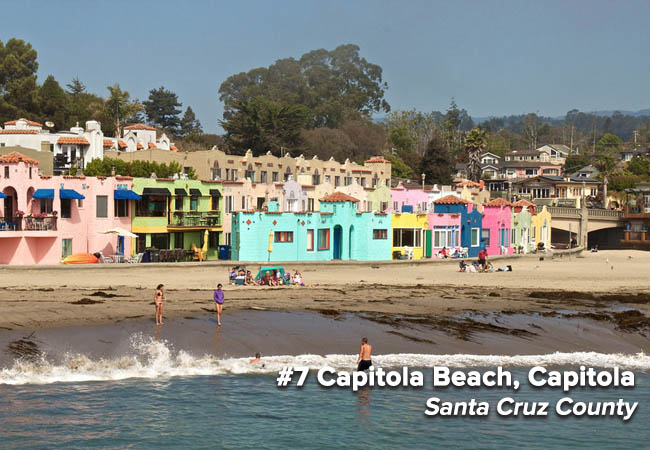
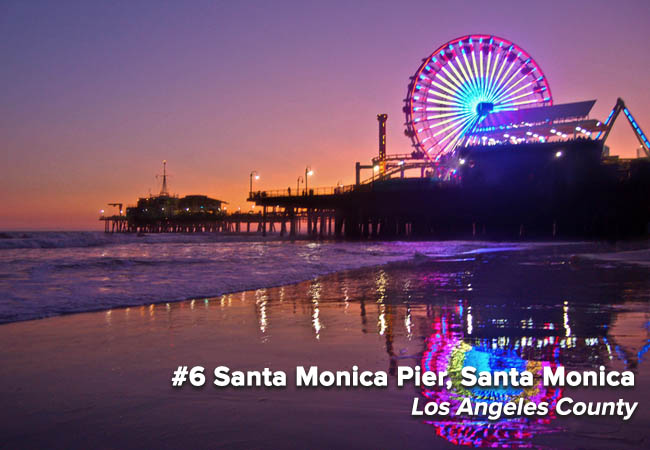
But pockets of fecal bacteria still trouble our waters and threaten the health of millions of beachgoers. Here’s our look at the 10 most polluted beaches in the state – our annual Beach Bummer List.

To avoid illness, ocean-goers can check the latest water quality grades at their favorite beaches, based on the latest samples, each week at beachreportcard.org (or download the Beach Report Card app for Apple or Android). For more information, check out our Beach Report Card blog post or read the full report here.