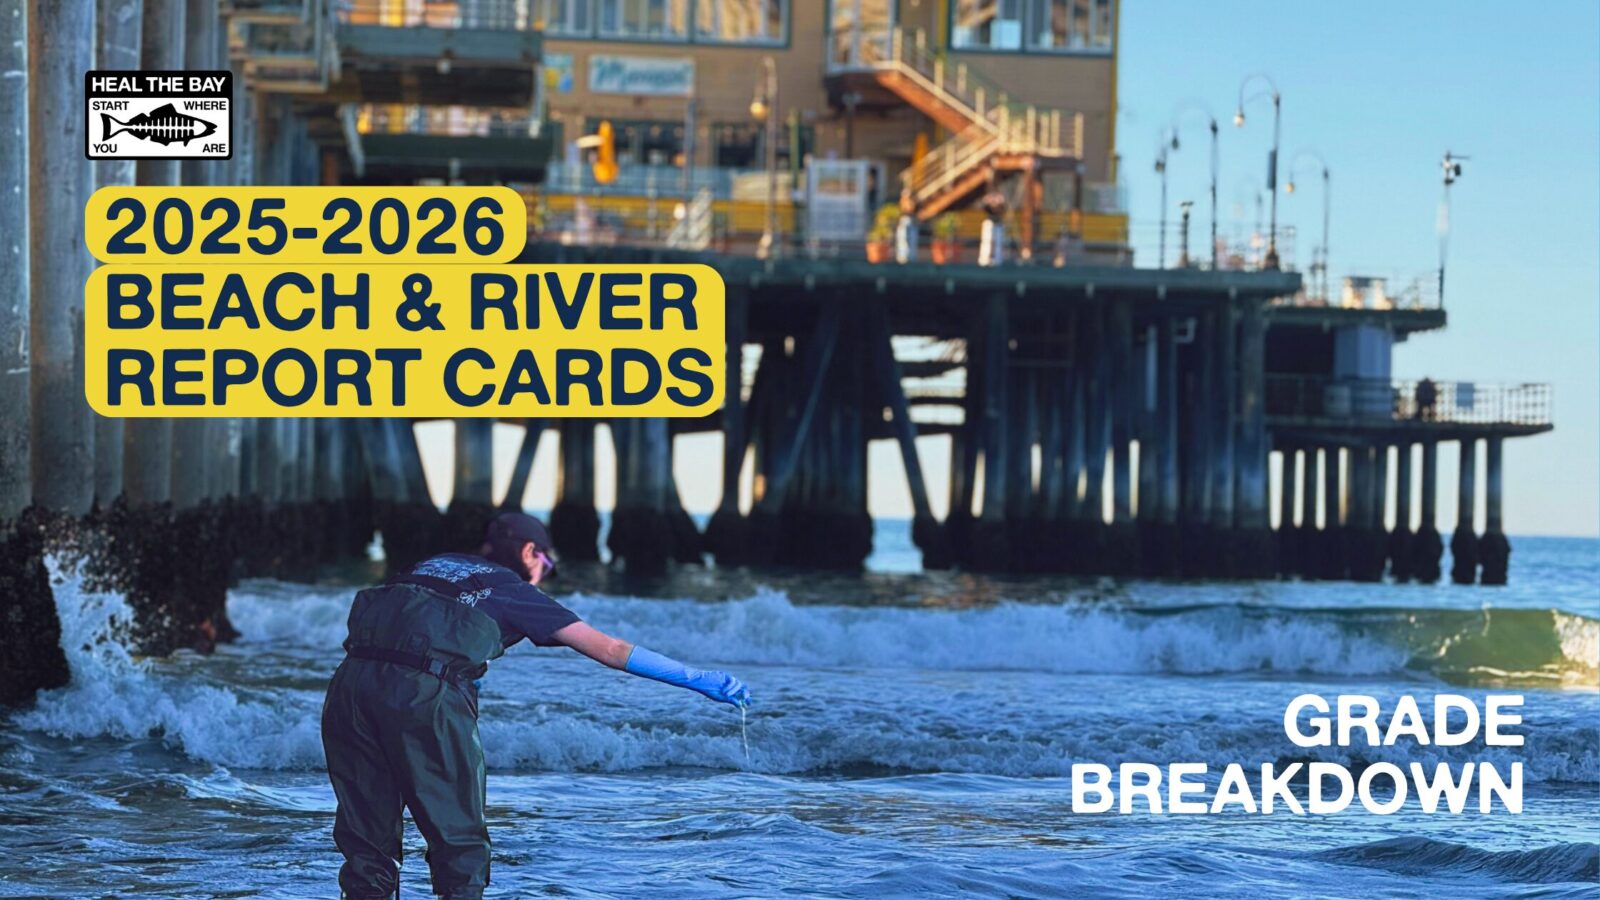
A single exposure to water contaminated with bacterial pollution can lead to illnesses, including rashes, ear infections, respiratory illness, and gastrointestinal symptoms. At Heal the Bay, we believe no one should get sick from a day at the beach or along a river, which is why our Beach Report Card and River Report Card translate bacterial monitoring data into simple A–F grades that help the public understand when and where it is safe to recreate. A and B grades represent generally safe-to-swim conditions, while C, D, and F grades indicate increased risk of illness. For more than 36 years these reports have been the gold standard for annual water quality monitoring.
Weekly water quality grades, available on our app and website, help residents and visitors make informed, real-time decisions about where it is safe to enjoy the water.
For deeper analysis, our annual reports provide a broader look at long-term trends. This allows us to highlight beaches and freshwater recreation areas that consistently support safe recreation and allows us to identify pollution hotspots where problems persist and action is needed.
See below for the annual grades and important insights from these reports.
The latest annual reports highlight three major statewide water quality trends:
California’s water quality remained generally strong last year, but wetter conditions and urban runoff led to slight declines. The 2025-2026 Beach Report Card found that 91% of beaches still earned A or B grades during summer dry weather, though wet-weather grades dropped statewide during storms. The 2025 River Report Card revealed similar declines in urban stretches of the L.A. River compared to the previous year.
Where you are matters; location and surrounding land use play a major role in water quality. Southern California saw some of the largest declines, as increased rainfall and stormwater runoff carried more pollution onto beaches and waterways. Freshwater quality was strongest in open-space upper watersheds but declined as waterways moved through more urbanized areas.
Persistent pollution hotspots continue to reveal long-term infrastructure challenges. Many of the same pollution trouble spots identified in previous years reappeared in this year’s reports, underscoring ongoing water quality issues tied to polluted runoff, low-flow conditions, and aging systems across both coastal and freshwater environments.
About the Reports
What are the Beach and River Report Cards?
Heal the Bay’s 36th annual Beach Report Card and 8th annual River Report Card take a deep dive into bacterial pollution trends at more than 700 beaches along the Pacific Coast and 35 freshwater sites in Los Angeles.
Each site gets an annual letter grade from A to F based on how much fecal indicator bacteria is found in the water during each testing season (summer dry weather, winter dry weather, and annual wet weather). The bacteria come from stormwater runoff, failing sewage systems, or other pollution, and they can cause illnesses like stomach flu, ear infections, upper-respiratory infections, and rashes. In short: The lower the letter grade, the higher the risk of getting sick.
All county health departments in California are required to test beach water quality samples for three types of indicator bacteria at least once a week during the summer season. Many counties also monitor heavily used beaches year-round. Heal the Bay compiles and analyzes the data to produce the annual Beach Report Card.
Freshwater sites don’t have the same monitoring requirements, so Heal the Bay deploys its own scientists with the Stream Team — students trained in field and lab techniques — and works with other local groups and municipalities to collect and analyze samples throughout the summer (May to September).
Bummers and Fails
Beaches and rivers that are chronic pollution hotspots
2025–2026 Beach Bummers
The Beach Report Card’s annual Beach Bummer list identifies the ten beaches with the poorest Summer Dry grades in California. Rankings for last year once again identified beaches impacted by storm drains, enclosed circulation patterns, and chronic problems with wastewater discharges and urban runoff.
6 of the 10 Beach Bummer sites were in San Mateo County, many within enclosed harbor or lagoon systems where limited circulation contributes to chronic bacteria problems. Beaches impacted by storm drains also continued to dominate the list.
Playa Blanca and the Tijuana Slough at the Tijuana River Mouth remain heavily affected by ongoing transboundary wastewater pollution originating from Baja California. Efforts are underway on both sides of the border to reduce sewage flows at the source and strengthen wastewater treatment and infrastructure to improve water quality over time.
The Santa Monica Pier continues to rank among California’s most polluted beaches during dry weather conditions. Heal the Bay is actively investigating bacteria pollution sources near the Pier through the Santa Monica Pier Task Force in partnership with the City of Santa Monica. For ongoing updates on this work, follow Heal the Bay.
2025 River Report Card Freshwater Fails
The River Report Card similarly identified recurring freshwater pollution hotspots concentrated in urbanized downstream sections of the L.A. River watershed. The Freshwater Fails list identifies freshwater recreation areas with the poorest annual water quality grades.
As watersheds transition into more developed areas, water quality conditions become more variable and begin to decline. In 2025, these areas also showed greater week-to-week variability, likely reflecting a mix of dry-weather urban runoff and, in some locations, possible localized post-fire impacts from the January 2025 Eaton Fire, underscoring how sensitive water quality is to both land use and short-term pollution events.
This downstream trend continues into heavily urbanized areas, where water quality is consistently lowest and chronic bacteria pollution persists. Sites in the Lower L.A. River watershed regularly show elevated bacteria levels and repeated exceedances year after year, reflecting the combined pressures of dense development and polluted runoff.
The Honor Roll
Beaches and rivers with excellent water quality
Despite statewide challenges, several beaches and freshwater recreation areas earned top marks for consistently excellent water quality.
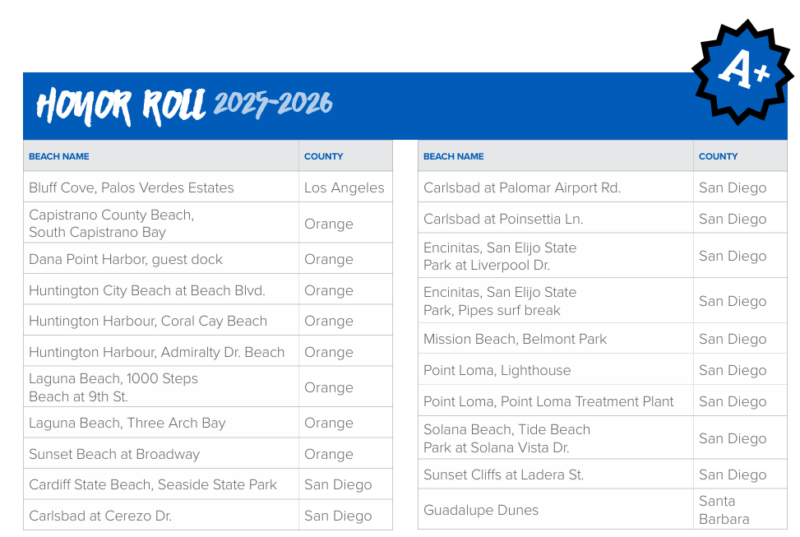
2025–2026 Beach Report Card Honor Roll
To earn Honor Roll status for the Beach Report Card, a beach must receive A+ grades during Summer Dry, Winter Dry, and Wet Weather conditions while being monitored year-round. This year, only 21 beaches earned a spot on the Honor Roll, down significantly from 62 beaches last year. Southern California beaches again dominated the Honor Roll, particularly in Orange and San Diego Counties.
2025 River Report Card Honor Roll
The River Report Card Honor Roll recognizes freshwater recreation areas with consistently excellent annual water quality and bacteria levels well below public health thresholds. Most Honor Roll freshwater sites are in upper watershed areas surrounded by natural landscapes and lower levels of urban development.
Tips to stay safe around beaches and rivers
Heal the Bay recommends taking a few simple precautions before entering recreational waters:
Avoid swimming at least 72 hours after rainfall
Stay away from storm drains, river outlets, and enclosed stagnant waters
Always check water quality conditions before you go using the Beach Report Card app or River Report Card website.
For 36 years, Heal the Bay’s Beach Report Card has evaluated fecal indicator bacteria levels at hundreds of beaches across the West Coast, from Washington State to Baja California, helping increase public awareness of bacterial pollution while supporting stronger water quality protections and expanded monitoring programs. The River Report Card was launched in 2017 to extend this approach to 35 freshwater recreation sites across Los Angeles County commonly used for swimming, wading, and other outdoor recreation, filling a long-standing gap in routine monitoring and public reporting for rivers and streams used for swimming and wading.
Together, these programs are designed to make water quality information publicly accessible, consistent, and comparable over time, so conditions can be tracked not just week to week, but across decades. This long-term perspective helps support public health decision-making and provides a foundation for agencies, researchers, and policymakers working to improve water quality management systems across the West Coast. As climate change intensifies rainfall extremes, wildfire impacts, and urban runoff pressures, accessible public health information and sustained investment in water infrastructure will only become more important.
What’s the difference between the annual and weekly report cards?
Weekly grades for beaches and freshwater sites monitored by Heal the Bay are available on the Beach Report Card (beachreportcard.org) and River Report Card (healthebay.org/riverreportcard) websites. These weekly grades are based on the most recent samples, offering a snapshot of bacteria levels to help people gauge their real-time risk.
The annual reports examine patterns and trends over longer periods to identify consistent problem spots, sources of pollution, and ongoing impacts. These findings help policymakers formulate solutions, aid scientists in improving testing and monitoring methods, and give the public a look at which waters are best avoided throughout the year.
How can I read the full reports?
The 2025-2026 Beach Report Card is available here. The full 2025 River Report Card is available here. Sign up for our Blue Newsletter to stay up to date on the latest Beach Report Card and River Report Card releases, water quality alerts, and coastal action opportunities.
If you care about science-based research that protects our coastline, watersheds, and public health, please consider donating to Heal the Bay. Your support powers critical water quality investigations and drives solutions for a more resilient Los Angeles.
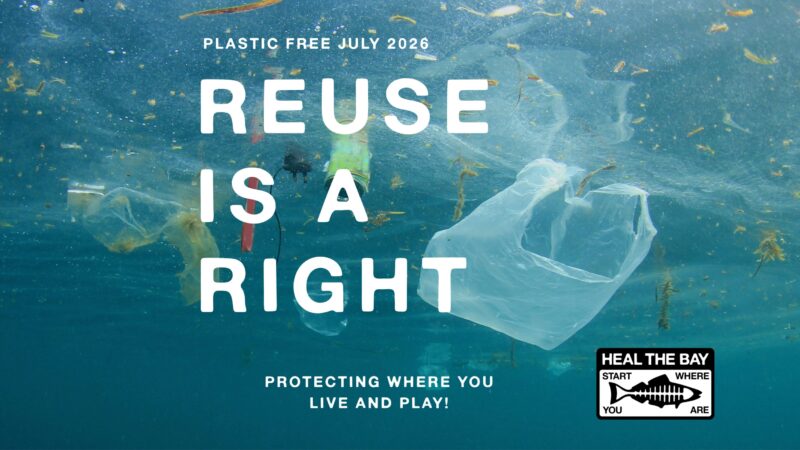
Less than 10% of all plastic ever produced has been recycled.
This Plastic-Free July, Reuse Is a Right. Learn why expanding reusable systems is key to reducing plastic pollution, then take action by signing our petition urging LA leaders to support a reusable future for Los Angeles.