
Aug, 5, 2016 — Staff scientist Katherine Pease launches our Freshwater Friday blog post, providing weekly updates on the latest bacterial exceedances at popular recreational zones
Heal the Bay’s inaugural study of Los Angeles River microbial water quality that we published last week and last year’s study on swimming holes in the Santa Monica Mountains called for more readily available public water quality information. The public has a right to know about water quality conditions in these freshwater recreation areas so that they can make informed decisions on how to minimize the risk of getting sick.
So beginning today with our Santa Monica Mountains sites, we will be posting a blog post every Friday during the summer with water quality information from our weekly sampling of freshwater recreation sites in Los Angeles County. (You can see this week’s findings at the bottom of this page, but first we want to explain our intent and methodology.)
We envision safe swimmable rivers and creeks throughout Los Angeles County. However, a number of recreational waterbodies are not regularly monitored or monitored at all. We know thousands of Angelenos use these aquatic resources.
As such, Heal the Bay would rather provide some information about the water quality they are immersing themselves into rather than no information. The idea is to prompt the user to ask questions about these waterbodies: What is the origin of the water? Can I get sick from it? What types of illnesses can I get? How do I get more information? We will be posting a Frequently Asked Questions document next week to help answer some of these questions.
Heal the Bay has been monitoring water quality in streams and rivers since 1998 through our Stream Team program. In 2014 we initiated a pilot study to monitor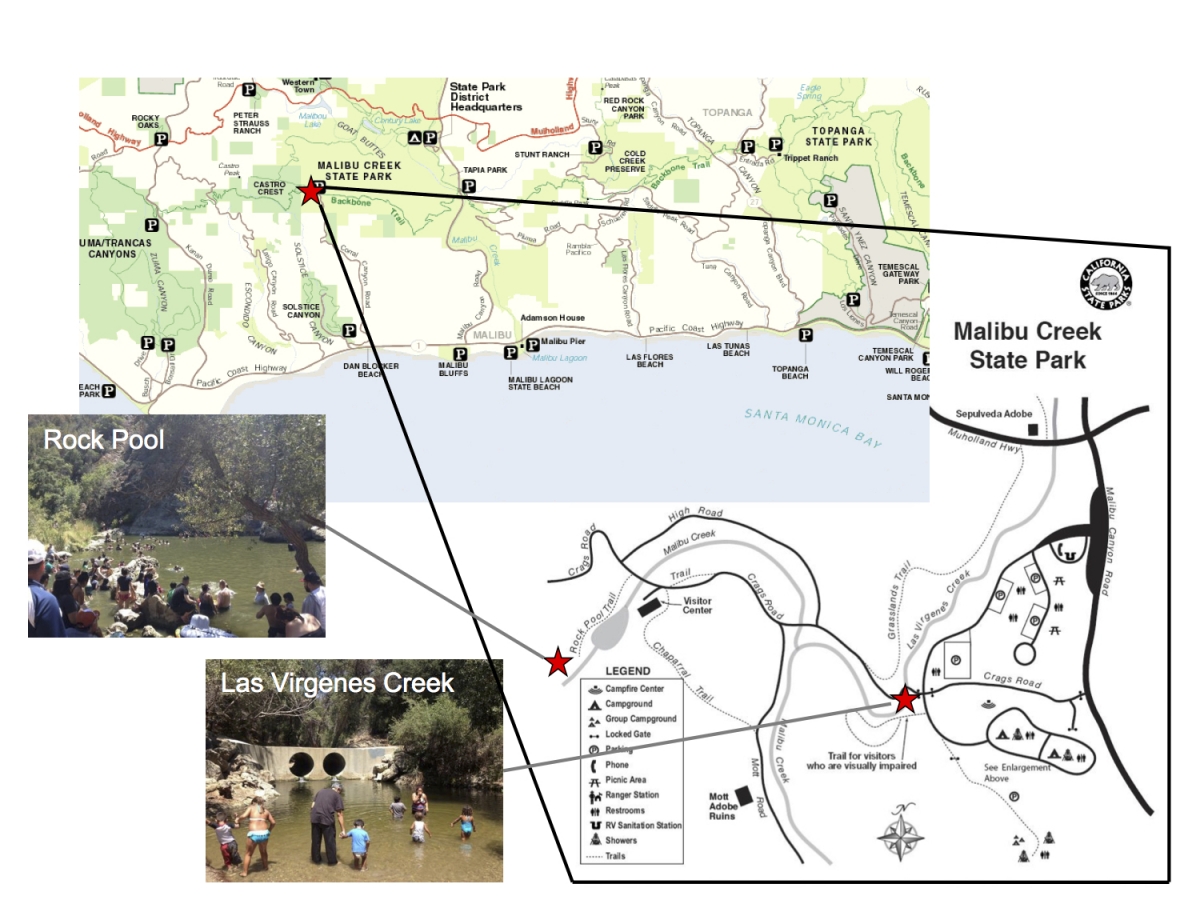 human use and water quality at freshwater swimming spots in the Santa Monica Mountains, focusing on bacterial pollution and public health implications.
The A-to-F grading system of the Beach Report Card took years of work to develop and fine-tune. We are only in the very early stages of thinking about an analogous River Report Card. But we want to start by making basic water quality information available to the public in a timely manner.
We will be providing weekly information about levels of fecal indicator bacteria at five sites. We will report on whether the sample from the current week exceeded limits set by the Regional Water Quality Control Board and US EPA and what the microbial water quality has been over the summer sampling season thus far.
We will report on two types of fecal indicator bacteria, or FIB: E. coli and Enterococcus. FIB, while not harmful themselves, indicate the possible presence of pathogenic bacteria, which have been found to cause ear infections, skin rashes, respiratory illnesses and gastrointestinal illness. High levels of FIB are particularly concerning in areas where people come in contact with water through activities like swimming, fishing, and kayaking.
Excuse us for getting technical in this next section, but we just want to be clear about what we are measuring and what constitutes an exceedance.
We compare bacteria levels measured at each site to water quality objectives from the Total Maximum Daily Loads (TMDL) for Bacteria in the Malibu Creek Watershed and EPA’s 2012 Recreational Water Quality Criteria (RWQC)
The freshwater regulatory limit for E. coli is set in the TMDL at 235 MPN/100ml for a single sample and 126 MPN/100ml for the geometric mean. (A geometric mean is a type of average that results in a number that is not as heavily affected by very high or very low values).
We calculate geometric means from all samples over the last 30-day period (usually four or five samples). For Enterococcus, we used EPA’s statistical threshold value (for an illness rate of 32/1,000 (the more protective rate), which is 110 MPN/100ml for a single sample and 30 MPN/100ml for the geometric mean in a fresh waterbody designated for recreation.
For each site, we will report on the number of criteria that exceeded four standards. A site can have 0-4 out of four exceedances. A sample exceeds if:
E. coli single sample > 235 MPN/100ml
E. coli geometric mean > 126 MPN/100ml
Enterococcus single sample is > 110 MPN/100ml
Enterococcus geometric mean is > 30 MPN/100ml
So, what does that all mean?
The greater the number and magnitude of exceedances at a site, the worse the water quality is, indicating a potentially increased risk of getting sick.
Deciding what to do with this information depends on the risk level you are comfortable with. Single sample values give you an indication of the most recent water quality, while geometric mean values give you an indication of the ambient water quality over the last 30 days.
However, it is important to note that the single sample gives information for the day on which the sample was taken and conditions can change throughout the week until the next sample is taken.
The thresholds that the US EPA and the RWQCB have put forth are based on epidemiological studies and risk. An increased risk of illness is not a guarantee that you will get sick. Certain activities are more risky when water quality is poor; for instance, swimming and submerging your head is more risky than wading; swimming is more risky than kayaking; kayaking is likely more risky than hiking (at least with regards to picking up a waterborne illness), and so on, with the risk dependent on how likely you are to ingest or contact water.
We recommend following these best practices to stay safe and healthy.
- Swimming: In waters known to exceed bacterial limits, swimming is not recommended, particularly submerging one’s head. Elevated bacteria levels can occur at any time. Swimmers should use caution when entering the water by checking the latest water quality results, avoiding contact immediately after a rainfall, if they are immunocompromised, or if they have an open wound. If there is any water contact, then rise off with soap and water afterward.
- Kayaking and Fishing: In waters that are known to exceed bacterial limits, people should limit water contact, especially avoiding hand-to-face water contact. Users should not enter the water with an open wound, if immunocompromised, or after a rainfall. If there is any water contact, then rinse off with soap and water afterward.
Malibu Creek State Park
for the week ending August 3, 2016
1. Rock Pool: Three exceedances
Three of the four criteria exceed the threshold values this week at Rock Pool site in Malibu Creek. For E. coli, the single sample and geometric mean values were over threshold values; the single sample Enterococcus value was under the threshold of 110 MPN/100ml but the geometric mean value was over the threshold value. Since June 15, 2016, we have documented exceedance rates (for single samples) of 43% for E. coli and 14% for Enterococcus at this site.
2. Las Virgenes Creek at the bridge: Three exceedances
Three of the four criteria exceed the threshold values this week at Las Virgenes Creek at the bridge. The single sample E. coli value was below the threshold of 235 MPN/100ml but the geometric mean for E. coli was over 126 MPN/100ml, and both the single sample and geometric mean values for Enterococcus were over their respective thresholds. Since June 15, 2016, we have documented exceedance rates (for single samples) of 29% for E. coli and 57% for Enterococcus at this site.
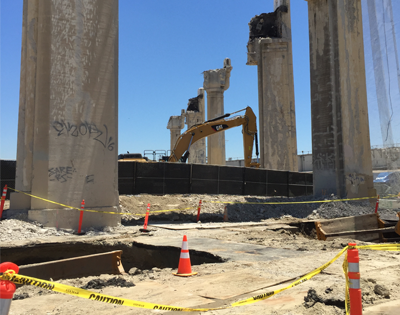 We pulled up to the site, located where active construction is already going on – the highly publicized demolition of the 6th Street Bridge in Boyle Heights. The immediate rupture area was now cleared of the heavy machinery ever-present during the months-long razing of the iconic bridge, but I could still hear demolition crews working nearby. I couldn’t help but wonder if all this heavy construction nearby might have played a role in the failure of the sewer line.
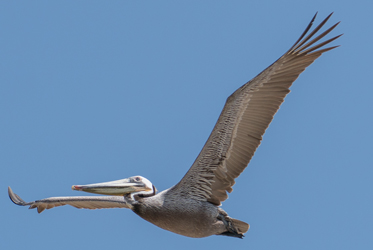
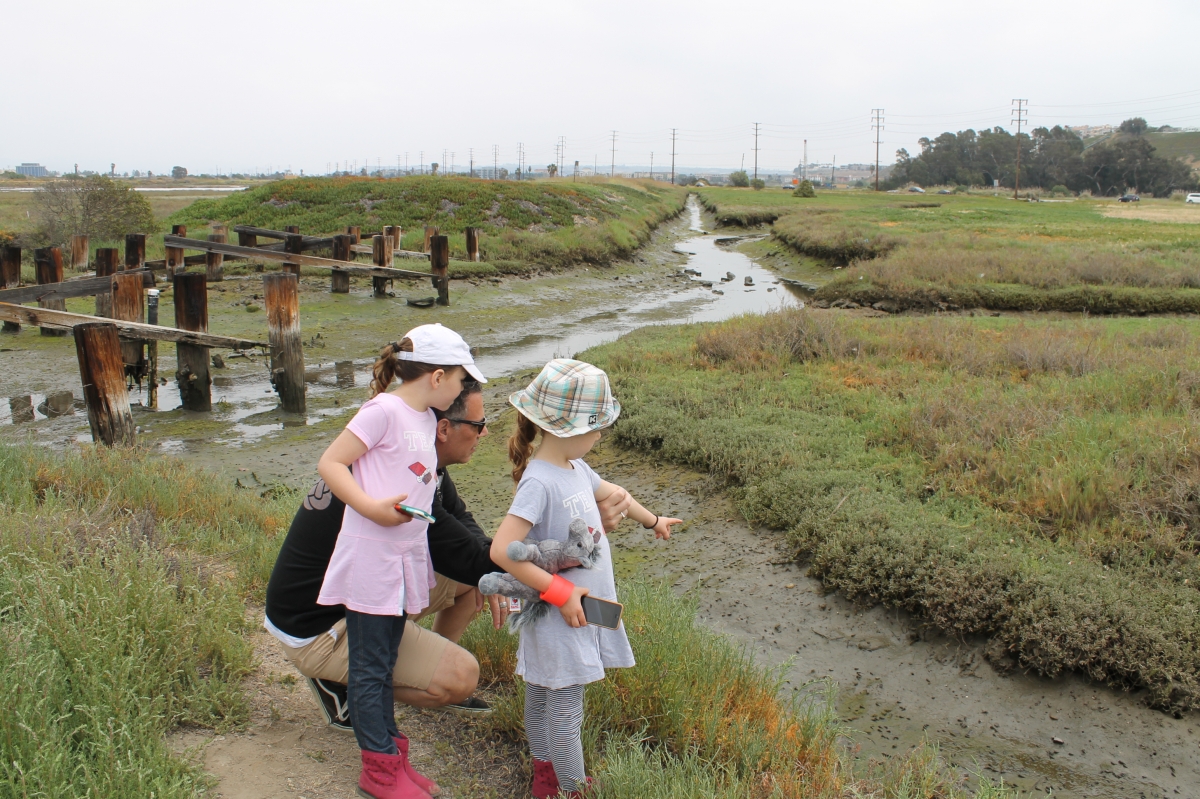
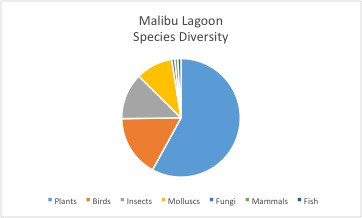 Most of our observations were of the amazing plants that rely on the wetlands to thrive. Plants form this environment’s base, providing a natural filter for water as it passes through. They also provide habitat, food, and shelter for the populations of birds, insects, and reptiles that live in wetlands. We found both sites were host to dozens of bird species including great blue herons, snowy egrets, and brown pelicans. Every year, almost one billion birds migrate along the coast of California in an area known as the Pacific coast flyway. Wetlands in Southern California are a crucial pit stop for migratory birds and the diversity of species we observed is promising. In just three hours at Ballona, we saw 17 different species of birds – almost a third of the bird species found in an extensive wetlands survey conducted by The Bay Foundation that spanned months. This shows the power of BioBlitzes to capture important data for conservation.
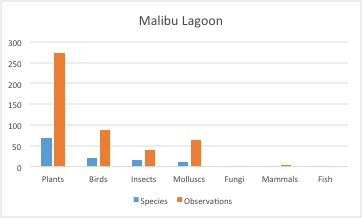 From 2012 to 2013, Heal the Bay advocated for an ecological restoration of Malibu Lagoon which involved removing invasive species, replanting native ones, and adjusting the hydrology of the wetland. Inventories done by The Bay Foundation showed only six species of native plants prior to restoration, while almost 41 were noted after the restoration! Since plants form the base of an intricate web of life in the wetlands, bringing back natives can also bring back other species – including those that are threatened. At both sites our BioBlitzers found four threatened species, but that number will certainly increase with more sampling.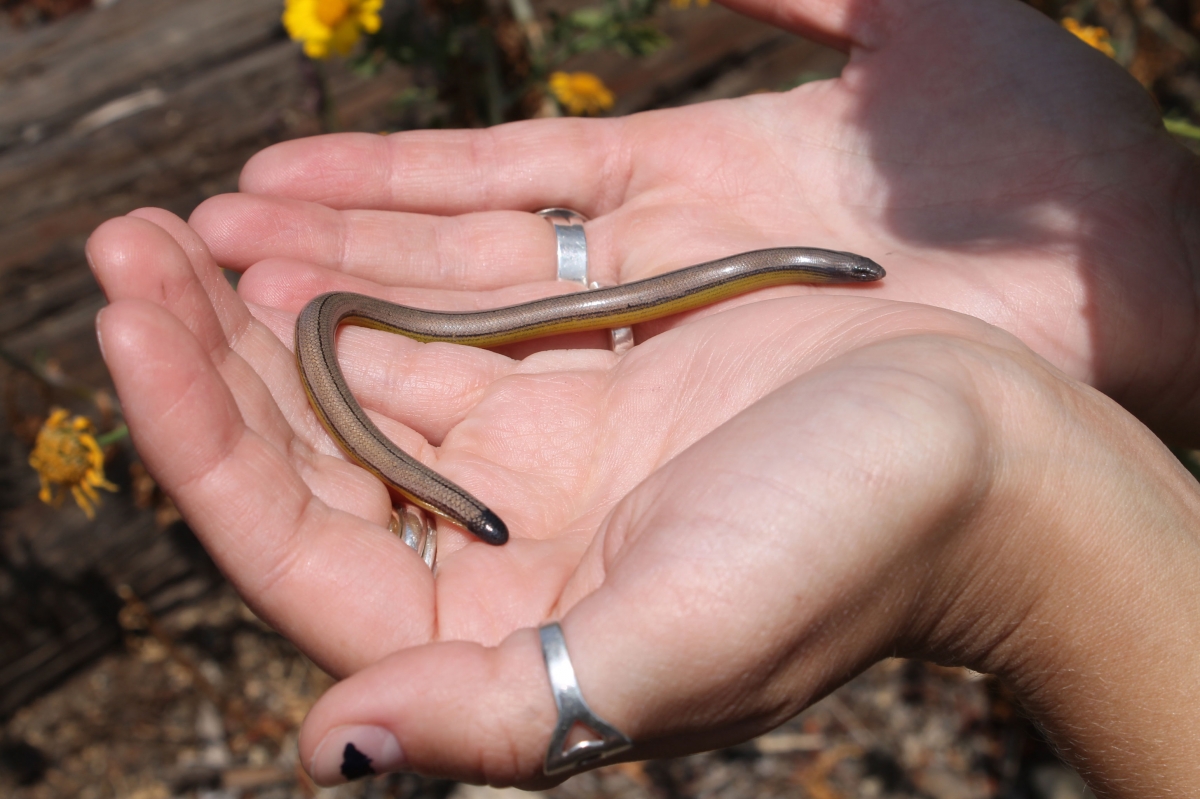
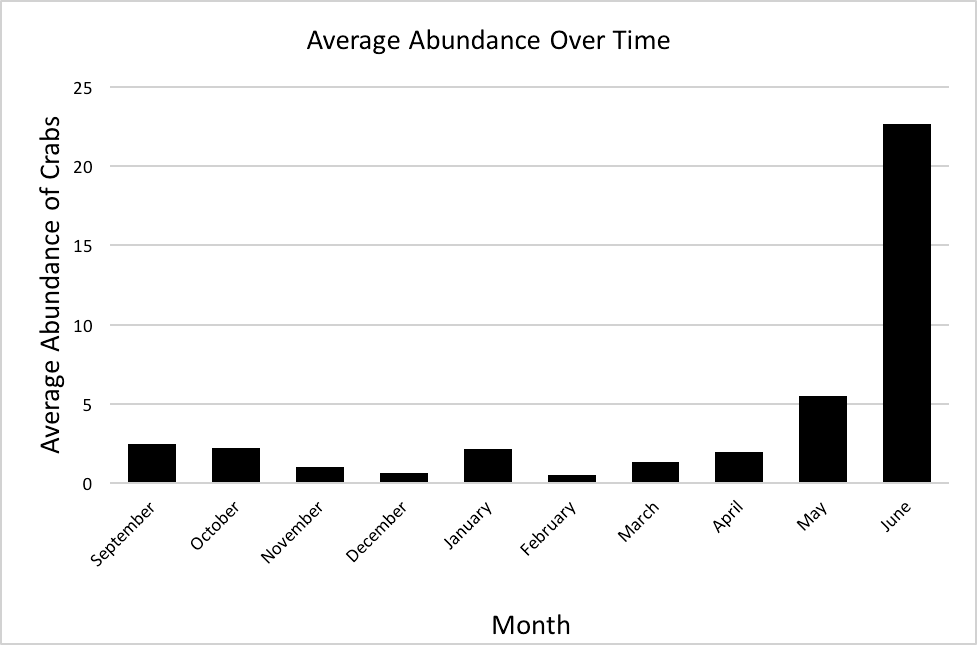
 Taylor Spesak is the Aquarium’s public programs educator. Join him every Wednesday at 3pm for sand crab monitoring. The program is included with
 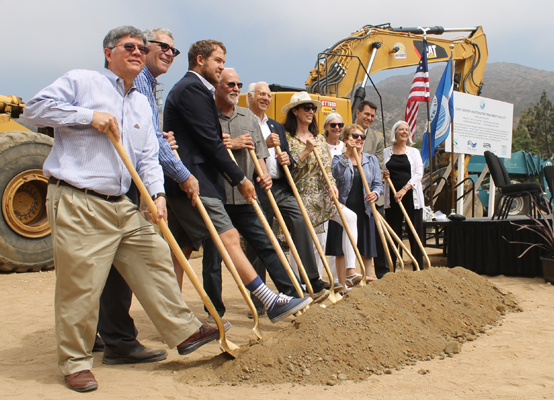 It was especially gratifying to see Mark Gold, past Heal the Bay president and current board member, in attendance. Amid often fierce opposition from city officials and some Malibu property owners, Gold led the charge to demand an end to septic tanks in the Civic Center area for many years. He helped broker an MOU between the city and the regional water board that phased out septic tanks and mandated the building of a more modern treatment facility. (You can read more about his war wounds in one of his blog posts