Top

Heal the Bay Blog

Category: Locations

Nov. 30, 2016 — After nearly 30 years guiding the influential Friends of the Los Angeles River, Lewis MacAdams has decided to hand over the reins. Here, longtime ally James Alamillo, Heal the Bay’s urban programs manager, reflects on our shared history.

Heal the Bay and the Friends of the Los Angeles River (FOLAR) both got their start in 1986, upstart nonprofits focused on grassroots change. The organizations have since matured and have shaped the Los Angeles environmental scene for the past 30 years. As though they were cut from the same fabric, Heal the Bay founding president Dorothy Green and FOLAR co-founder Lewis MacAdams both made it their life’s work to protect two iconic landscapes of Los Angeles — the Santa Monica Bay and the Los Angeles River. Mobilizing everyday people, they developed a successful formula to rehabilitate, protect, preserve, and share special places with current and future generations.

The two Los Angeles environmental giants, and their respective organizations, began crossing paths in the early 1990s when the Los Angeles County Flood Control Department and U.S. Army Corps of Engineers proposed raising the walls on the Los Angeles River – an effort known as the Los Angeles County Drainage Area Project, or LACDA.

Both Dorothy and Lewis were so adamant about instituting comprehensive watershed management planning principles to the Los Angeles River and other watersheds, that they formed the Coalition to Restore our Watershed, also known as Un-Pave LA. Over the next six years, they fought the LACDA project to ensure that watershed principals were incorporated into the project’s Environmental Impact Report. Although the LACDA project was eventually built, the process gave birth to yet another organization – the Los Angeles and San Gabriel Rivers Watershed Council, a group intent on bringing watershed management principals to public agencies.

Since then, FOLAR and Heal the Bay have collectively worked together to improve the Los Angeles River and its tributaries. Through it all, Lewis has always been part of the process, whether it was supporting volunteer clean-up programs, talking to media, testifying before the Regional Water Quality Control Board on a 401-water quality certifications or a total maximum daily load for trash, reviewing data collection on fishing or swimming, promoting the river’s restoration, or supporting the ARBOR Study.

While the partnership between Heal the Bay and FOLAR will continue, Lewis’ passion for the river will be greatly missed. Heal the Bay is honored to have traveled the Los Angeles River journey with Lewis. We wish him well as moves on to his next endeavor.


After its second season predicting water quality in California, Heal the Bay’s NowCast program will hibernate until 2017. It’s a fitting moment for reflection by our fabulous beach water quality scientists, Ryan Searcy and Leslie Griffin.

Many would say that there are two distinct seasons in Southern California: summer and not-summer. By this way of thinking, it’s been hard to tell which season we’re currently in. We did see a bit of rain a few weeks ago, and it is certainly brisker in the mornings (hello fall sweaters!). Surf’s up in a way that whispers ever-so-slightly, “winter is coming.” But ocean water temperatures around here are still warm, and there is still plenty of sunshine, perhaps making the date-challenged among us wonder if Labor Day has indeed passed. You California dreamers out there can keep hanging on, but for those of us in the water quality business, the end of the AB411 season means it is officially not-summer.

State Assembly Bill (AB) 411 requires coastal agencies to sample water quality at popular beaches at least once per week from April 1 to October 31, and to notify the public of high concentrations of bacteria in those samples. Water quality samples measure the amount of fecal indicator bacteria (FIB) present in the water, organisms that are known to be associated with the presence of harmful human pathogens. If FIB levels are found to be above the prescribed state standards, that beach is required to be posted as hazardous to swimmer health.

Fortunately for us in Southern California, most of our beach agencies sample water quality year-round. But despite increased testing, these water quality samples have a serious draw-back: because bacterial culture methods (FIB tests) take 1-2 days to process, beachgoers never actually know if the water is safe on the day they visit the beach. This is a serious problem, and it is one that we’ve been trying to remedy for many years.

Historically, the Beach Report Card has only been able to report on how water quality has been at a beach according to the week’s bacteria sample data and the geometric mean of a handful of recent samples. It is still a great guide for beachgoers because it provides more information about beach water quality than any other system on the West Coast. But we wanted to make it even better, and that is why we have worked with Stanford University and UCLA to develop the California Water Quality NowCast system.
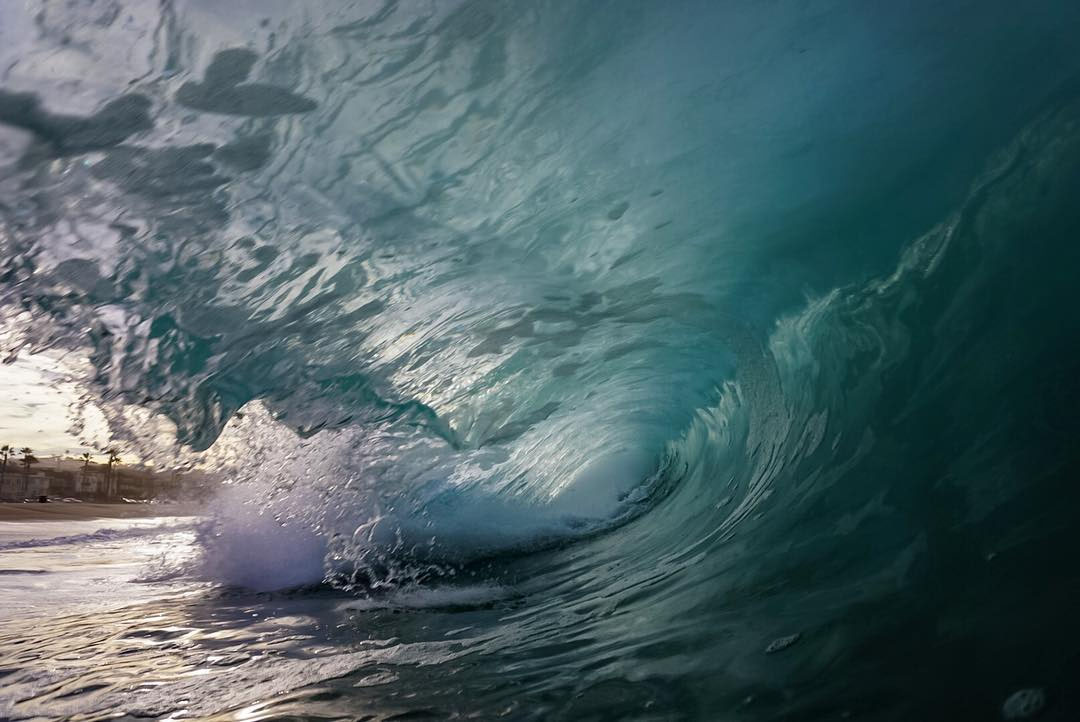
Our NowCast system uses statistical models to provide daily water quality information during the AB411 season. These models predict the concentration of bacteria in the water every morning, and are derived from years of water quality data and a whole lot of environmental variables that impact bacteria levels. NowCasting helps us answer what we don’t readily know – how much bacteria is likely in the water each morning, and thus if it is safe to swim – by looking at what we do know – what was the weather like yesterday, were there a lot of waves this morning stirring up the water, is the nearby river a’ flowing, etc. All of this data crunching and statistical hog-wrestling boils allows us to predict whether beach bacterial concentrations are likely to be safe or hazardous each morning.

This was our second summer implementing the NowCast program. In 2015, we provided daily predictions for three beaches in Southern California: Arroyo Burro in Santa Barbara, Santa Monica Pier, and Doheny State Beach in Orange County. This year, we added East Beach in Santa Barbara and Belmont Pier in Long Beach to the program, and were able to make over 120 consecutive days of predictions for these five beaches. These predictions were available every morning by 10AM (including weekends) on our Beach Report Card site and mobile app. The beach agencies we worked with also took our results and posted them on their own sites and telephone hotlines.

And now that the Summer 2016 season is over, we are able evaluate our findings and to see how well our models did compared to the ‘current method’ of using days-old samples to make daily beach management decisions.
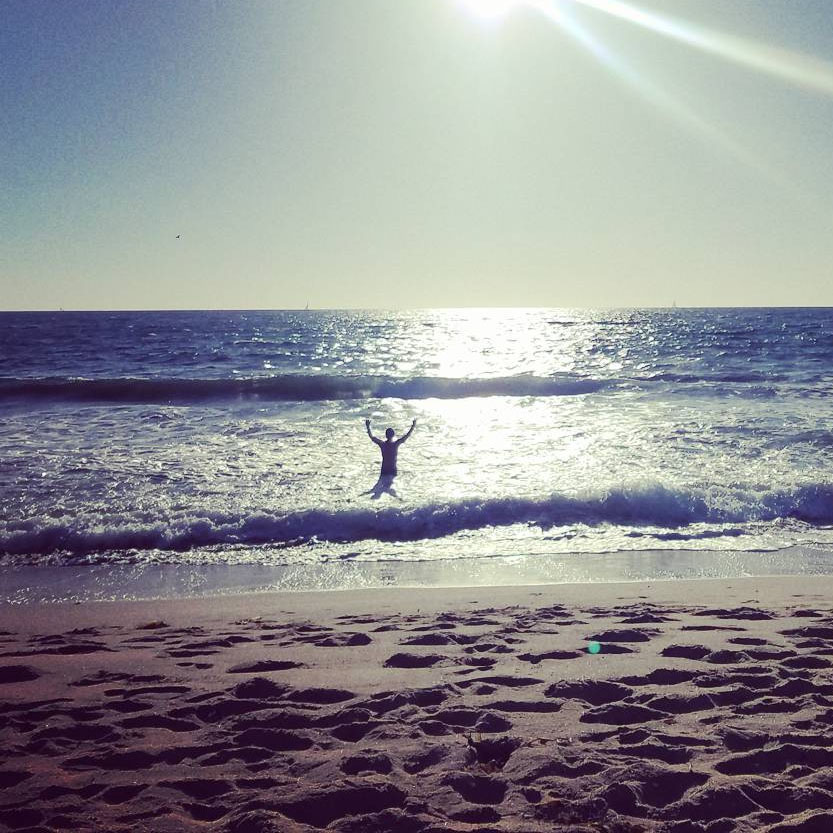
The first major finding of the season was expected: the drought continues to positively impact beach water quality. Think about it like this: less rain means less runoff which means less bacteria in the waves. And as Californians continue to conserve water, there is less dry-weather runoff from outdoor watering (nice work, by the way!). Every beach in the NowCast program (except at the Santa Monica Pier) recorded water samples that came back under sample limits (the levels of bacteria below which it is reasonably safe to swim), much cleaner than those beaches’ historical trends! This is great news for California beachgoers – they were able to enjoy cleaner than average conditions this summer at the NowCast beaches, something that we were able to inform them of on a daily basis.

However, since beach conditions were so clean, it makes it difficult to see how we would have done at predicting dirty conditions. Except for Santa Monica Pier, there simply were no dirty samples available to do this. While this is a frustrating for those of us who want to look at the statistics, we can find solace in the fact that the models provided daily water quality predictions to the public (rather than weekly, like most sites).
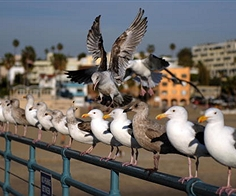
That being said, we did have one site with more issues than the rest: Santa Monica Pier. The Pier has a chronic history of water quality problems. From 2008-2015, it experienced 28% and 10% exceedance rates for fecal coliform and Enterococcus standards respectively (two types of FIB) in the summer months. This season, it exceeded those FIB standards 41% and 10% of the time respectively, despite drought conditions. This suggests that water quality at Santa Monica Pier is especially affected by other factors in addition to rainfall. Because our models consider wave action, wind speed and direction, and tides, the fecal coliform model for Santa Monica Pier was able to predict 71% of actual exceedances, and 17% more exceedances than using days-old samples in the months of July, August, and September. This was the big result that gives us confidence in our models.

However, in October, the models did miss some exceedances at the Pier, highlighting why we reassess and refine our models every year as conditions change at our beaches, and why we try to incorporate new sources of data into the modeling process. For example, we learned that water quality at Santa Monica Pier is affected by nearby storm drain flows and seabird populations, both things that we currently don’t have a good way to get daily data on. In time, we hope to incorporate these factors into our models, creating more robust and accurate predictions.
Looking forward, we’re excited for the California NowCast program to enter its third year. We’ve got a whole bunch of good stuff up next on the menu. For the Summer 2017 season, we are looking to add up to eight new beaches to the program. NowCasting will eventually expand farther along the California coastline, creating a truly statewide program. Winter models at beaches with heavy year-round use are also on our radar (in case you surfers out there were wondering). We’re designing new NowCast beach signage to post on days where water quality is predicted to be poor. And keep an eye out for our groovy new Beach Report Card website and mobile app, an update launching in 2017 that will look and function better than ever, giving beachgoers up to date water quality information on the fly.

When you go to the beach, we want you to catch waves, not a bug, and hopefully our NowCast program helped you do that this summer. Thank you to everyone who used and participated in the NowCast program in 2016, especially our beach agency partners across the state. Enjoy not-summer, and see you next year!


UPDATE: 4:14 p.m., Nov. 10, 2016:

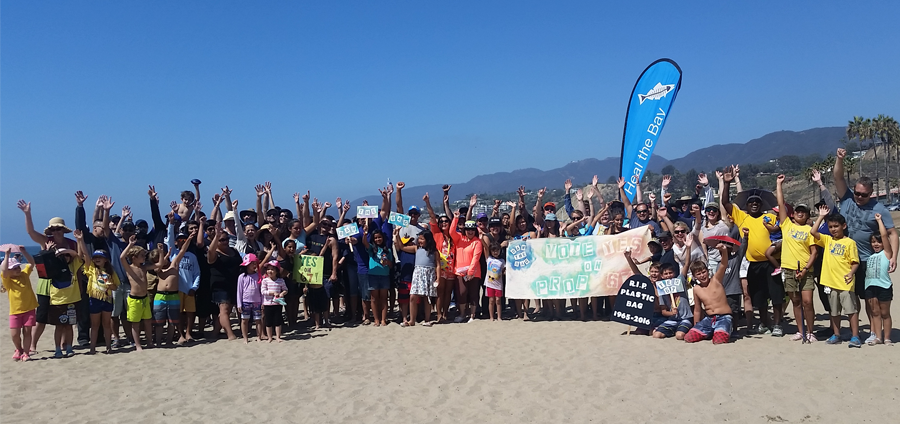
While California waits for the last 3 million mail-in votes to be counted, it is projected by a number of influential media outlets that Proposition 67 will PASS! Once the Secretary of State declares the results official, the plastic bag ban will go into effect immediately. This makes California the first state to pass a comprehensive ban on single use plastic bags. As the nation looks to California as a progressive environmental leader, we hope that our hard-fought, grassroots-led victory inspires other states to enact a bag ban of their own.

We’re grateful for the passionate, powerful coalition of environmental groups, community leaders, and dedicated volunteers, without whom this victory simply wouldn’t have been possible. 

For the latest Prop 67 results coverage, check out the Sacramento Bee and New York Times.

Nov. 9, 2016 — Tova Handelman, Heal the Bay’s Coastal Resources Coordinator, dives into the election results and finds some treasures worth celebrating.

So much has happened in the last 24 hours. The dust has yet to settle from the presidential and state elections. Through the haze, it can be hard to see the long, grueling path that led us here. Even more uncertain is what the road ahead looks like for the country, and its environmental progress.

Well before the primaries and up until yesterday, Heal the Bay – alongside our incredible partner organizations, and fueled by dedicated members like you – led efforts to enact some real environmental change locally and across California during this election season. We advocated for several propositions and city measures before, and are truly proud to see the results of our efforts this time. This campaign season has given us a lot of firsts–some good and some downright puzzling. But we are proud to say that this is the first time we’ve seen such across-the-board success for the environmental measures we worked so hard to endorse.

Let’s take a look at some key environmental measures on the ballot–and what will happen next:

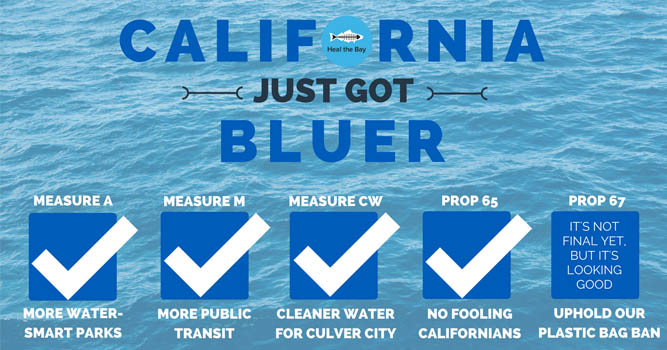
Measure A: PASSED!

A big victory with a huge margin, Measure A passed with 73.5% of the Los Angeles vote. This means that an annual parcel tax of 1.5 cents per square foot of development will generate approximately $94 million per year. This money will go directly to local communities to protect, enhance, and maintain our local parks, beaches, and open spaces.

Measure M: PASSED!

Sick and tired of traffic and its effect on air quality in Los Angeles? You’re not alone: Measure M passed overwhelmingly with nearly 70% of the vote – well over the two-thirds share it needed to pass. Measure M adds a half-cent sales tax and extends the existing half-cent increase passed in 2008 with Measure R. This tax will generate $120 billion over 40 years to fund major extensions to subway lines, including a line under the Sepulveda Pass to connect the San Fernando Valley to West Los Angeles.

Measure CW: PASSED!

Residents of Culver City voted to create a dedicated funding source in the form of a parcel tax to pay for water quality programs that will prevent pollution in our waterways, beaches, and the Ballona Creek Estuary. The tax is expected to generate $2 million per year, and all money will be used in Culver City to reduce water pollution. This will ultimately help to improve water quality in Santa Monica Bay!

Proposition 65: FAILED!

Try as they might, the plastic bag manufacturing companies behind Prop 65 couldn’t trick us into undoing California’s plastic bag ban. This proposition was intentionally vague to confuse voters by thinking they were voting for an environmental fund, when the fine print actually said the bag ban would be overturned should Prop 65 pass. Thanks to our tireless volunteers and incredible efforts from partner organizations, we were able to get the word out and educate voters on the issue. Looks like Californians do their homework, because we are now one step closer to banning plastic bags from grocery stores statewide.

Proposition 67: NOT FINAL YET, BUT IT’S LOOKING GOOD!

Heal the Bay has been working for years to eliminate plastic pollution from our waterways and beaches. Two years ago, we rejoiced when SB270 passed, making California the first state to ban plastic grocery bags. The plastic bag manufacturers didn’t take the news well, however, and spent over $6 million to get the bill back on the ballot as a referendum in the form of Prop 67. Our volunteers spent long days at tabling events and long nights phone banking to encourage voters to uphold our statewide plastic bag ban, and it seems like their efforts paid off. The polls are too close to call just yet, but the projections are promising. Once the final verdict is called, the plastic bag ban will go into effect immediately at grocery stores, pharmacies, and liquor stores across the state. Paper bags will still be available for 10 cents. Over 660 ocean species have been found to ingest or become entangled in plastic pollution, so a statewide ban is a HUGE victory for the environment–and ocean animals.

Though it is unclear what will play out nationally, there is one thing you can certainly count on: Heal the Bay will continue to fight to protect what you love. Supported by thousands of ocean-loving Angelenos and guided by sound science, we will press on to advance local, regional, and statewide environmental policies and educate the next generation of ocean advocates.

Thanks to you, we won so much yesterday. And with your help, we will continue fighting, stronger than ever, for a cleaner, healthier, bluer Los Angeles.


Nov 4, 2016 – The syringe saga begins anew, writes staff scientist Steven Johnson.

If you live in Los Angeles, I have a new program for you to watch.

It’s a televised drama that contains high-stakes political maneuvering, involves people who unwittingly end up exposed to a dangerously sharp edge when you least expect it, and deals with a war of Five Kings.

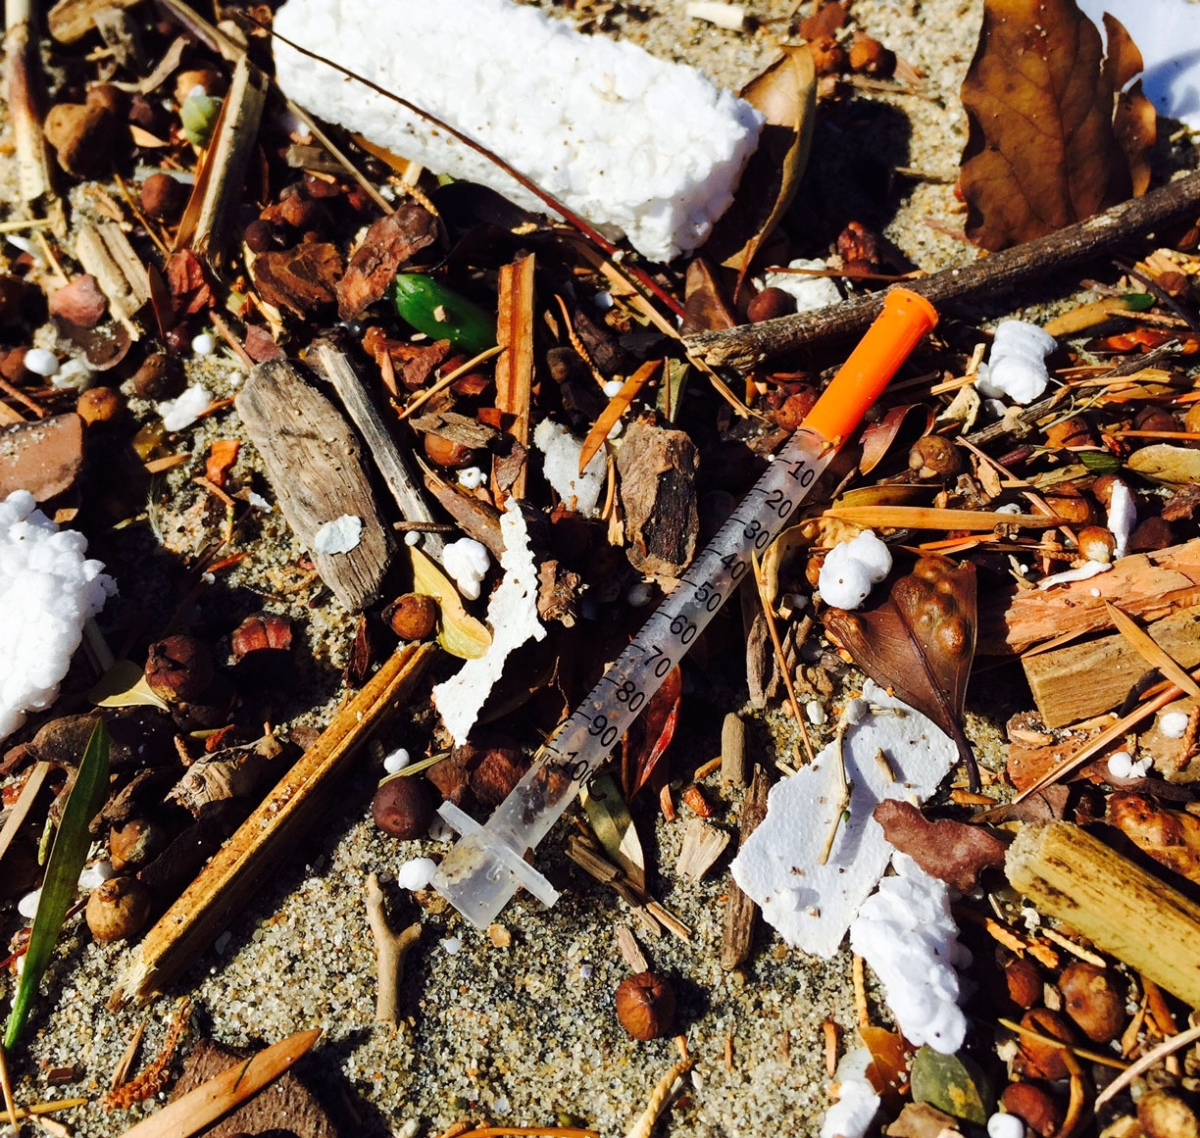
What? You know the program I’m talking about? No, not Game of Thrones (but good guess) – something with a little less viewership and attention. It’s the sickening story of medical waste washing up on our local beaches. Let me quickly fill you in on last season, which ended in June 2016.

The “Five Kings” is a nickname that has been used for the Los Angeles County Board of Supervisors. This locally governing body originally got their name due to a combination of power, homogeneity, and longevity of the members. Term limits were voted in by 64% of Los Angeles voters in 2002 and the Board itself has since morphed to better represent the diversity in the County. They still retain their tremendous power over a growing constituency, however, which is what makes them so fascinating. Each of the five supervisors represents almost two million Angelenos apiece, which is 2,000 times as many people as the original 1,000 citizens each supervisor represented in 1852. Today you have what the L.A. Times has argued are the five most powerful locally-elected individuals in the nation.
Now you know the characters and the setting. Let me set the stakes.

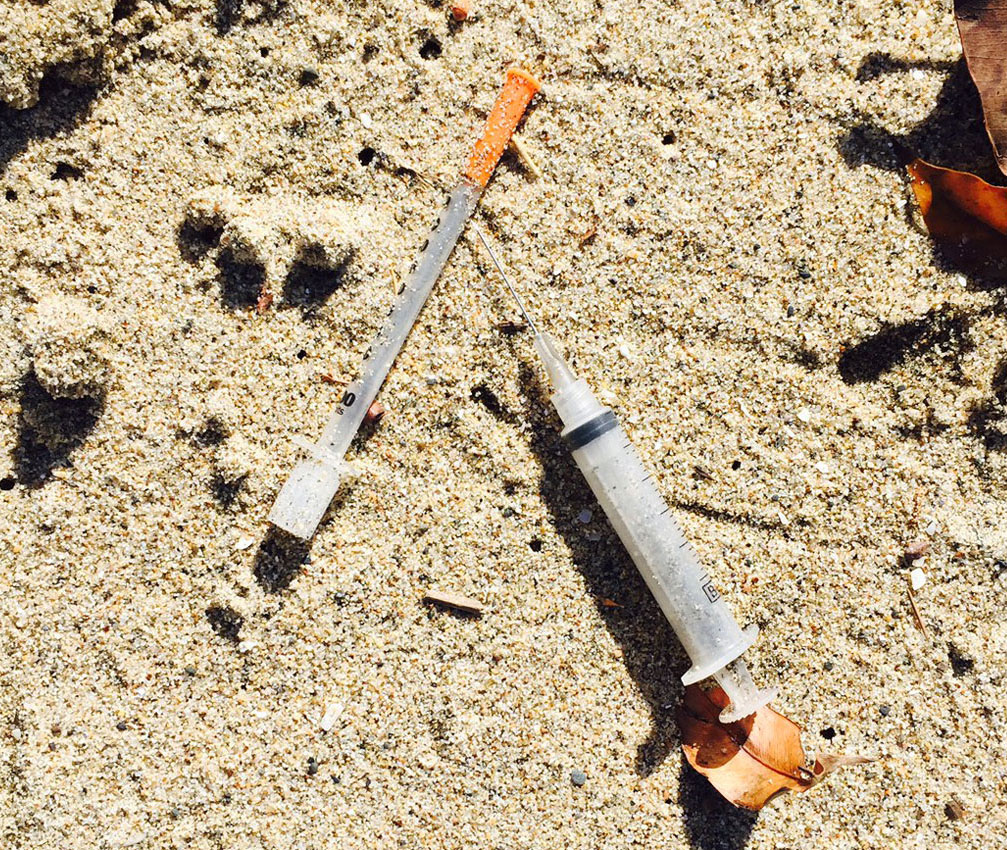
Early in 2016, Los Angeles County was set to have one of the most stringent used needles and unused prescription medication take-back programs in the country. At the time, only Alameda County (the county east of San Francisco containing Oakland, Berkeley, and Livermore) had such a program in place. This take-back program would ideally take the form of depositories (think mailbox/library book return) in Los Angeles drug stores and other convenient places. Heal the Bay believes that this ordinance will help keep used syringes off our shores and unused, yet abusable, medications out of our medicine cabinets and waterways. Currently, people either throw away syringes with other trash, where they can harm sanitation workers, or worse—flush them down the toilet. Heal the Bay became very aware of the danger of flushed syringes following last September’s Hyperion sewer spill, when hundreds of syringes, along with other medical waste, washed up on the shores around Dockweiler Beach. The take-back ordinance would be funded by the same people who profit from our prescription purchases in the first place: the pharmaceutical companies.
So what happened?

Over the course of spring 2016 the ordinance was delayed five times. This continued until the nail-biting season finale which took place this past June. On that fateful day, when Los Angeles County was supposed to confirm its comprehensive sharps and pharmaceutical take-back program, it was replaced in the eleventh hour and fifty-ninth minute by a watered-down public education campaign. The only similarity between the old ordinance and the new education campaign would be the funders – in both cases the pharmaceutical companies. They were asked to spend the next few months overseeing an education and outreach campaign and host quarterly take-back days.

Supervisors Sheila Kuehl and Hilda Solis, who have become leaders on the Board in the effort to establish the ordinance, warned their fellow supervisors that the proposed education program would fall far short of the original ordinance in addressing the issues posed by sharps and pharmaceuticals, and assured their constituents that they had not seen the last of the ordinance itself.

Months have gone by and the results of the public education program and take-back events have been announced. According to County of Los Angeles Public Health, the pharmaceutical companies’ campaign objectives in summary “were not approved.” Of the mandated “Education and Outreach, Take-Back Events, and Outcome Measurement Plans,” there were only two categories (out of the 43 total graded requirements) where the Pharmaceutical Workgroup actually met the Supervisors’ set criteria: The campaign messages were in fact translated into Spanish, and that the group did indeed “establish a single website.” In every other category the Pharmaceutical Outreach and Education Team either partially or totally failed.
Last week, Supervisors Kuehl and Solis proved they were keeping their word and have been paying close attention to the program. That brings us up to speed to what’s happened up until yesterday’s season premiere.

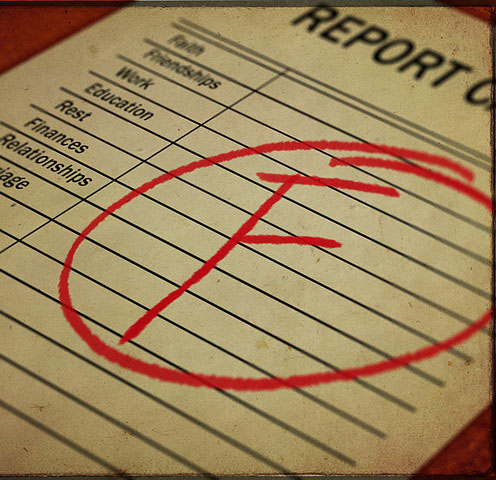
The inadequacies of the outreach campaign were discussed at the Board’s Tuesday, November 1 hearing. After hearing L.A. County Public Health officials’ report, Supervisors Solis and Kuehl reiterated their stance that the whole effort was disappointing, with Solis stating that the industry’s efforts would receive an F grade if it were a student.

Sheila Kuehl stated that the people of L.A. County “should have an easy choice” of where to get rid of their old medications and used syringes. She went on to say that as Supervisors, “it’s our responsibility [to make it happen] and we will take it.”

But when the other Supervisors spoke, those in support of the ordinance looked completely miffed, as Supervisors Antonovich, Knabe, and Ridley-Thomas all seemed to think the ordinance needed more work—despite almost a year of efforts, delays, and postponements. At this point the well-crafted take-back ordinance, to the dismay of its many supporters, was put in a state of limbo. And that’s where our most recent episode ends.

Looking at the season ahead, there is hope for the take-back program. There will be two new characters destined to join our outnumbered heroes. Two of the five kings will be replaced by new, undetermined Supervisors, as the newly initiated term limits have taken effect. Even the two electoral races to replace Supervisors Antonovich and Knabe themselves have been quite dramatic so far.

There are rumors that the take-back program will be presented again in front of the newly vitalized board as soon as January 2017.

Hearings begin at 9 a.m. on Tuesdays and are replayed each subsequent Wednesday night on television network KLCS at 10 p.m.

And unlike HBO, KLCS is free.

Stay tuned for updates in the coming months as the Syringe Saga continues…


October 11, 2016 — Watershed Scientist Katherine Pease, Ph.D., weighs in on the latest setback affecting the future of the Ballona Wetlands.

Way back in 2003, the State of California purchased the Ballona Wetlands, protecting one of our last remaining coastal wetlands in Southern California. Despite being protected, the Ballona Wetlands have been severely impacted by humans and are highly degraded. Thus, shortly after State acquisition, restoration planning began.

Fast forward thirteen years and we still do not have a plan for the restoration of the Ballona Wetlands.

Rumors had been circulating recently about a delay in the release of the much-anticipated restoration plan or Environmental Impact Report/Statement (EIR/EIS) for the Ballona Wetlands.

I am disappointed to say that official word has now confirmed those rumors. We are now told that we must wait until mid-2017 to see this document.

The draft EIR/EIS will detail and evaluate four tentative alternatives, ranging from the “No Action Alternative” – in other words, doing nothing – to a full scale restoration involving concrete removal to establish a more natural creek connected to the wetlands, walking and biking paths, and creation and enhancement of wetland habitats. The Army Corps of Engineers and California Department of Fish and Wildlife (CDFW) are the lead agencies preparing the EIR/EIS and will make the final decision about restoration plans.

This further delay is unacceptable. The Ballona Wetlands need restoration and action needs to be taken now. Southern California has already lost 95% of its coastal wetlands. We need to act quickly to protect and restore our remaining 5%.

Heal the Bay and partners have been participating in good faith in a public process that began in 2006. The draft EIR was due in 2012. We have been awaiting this document for four years – that’s right, we are four years behind schedule. The deadlines have continually been pushed back and surpassed, but this time felt different; I was sure we would see the EIR in 2016. Alas, it was not meant to be. But that doesn’t mean that we’ll just sit around waiting patiently – we need to speak up and hold the Army Corps of Engineers and CDFW accountable.

What is the explanation for the delay?

  • The official notice states in great brevity that the delay is “due to the identification, discussion and resolution of various questions and concerns from the project agencies involved.”
  • We ask for more transparency and specific details about the delay. What are the questions and concerns? How will they be addressed? We suggest a public meeting to discuss the process. 

What assurance do we have that the new timeline will be met?

  • Transparency in the process about what went wrong will help give us confidence that the new timeline will be met. Further, we would like to see specific interim goals with dates to ensure that the process stays on track to meet the new timeline. The document needs to be made public as soon as possible. We ask that this work be prioritized and be finished by the end of 2016.

Heal the Bay will meet with partners, agencies, and elected officials to try to get answers to these questions and to put pressure on the lead agencies.

If you support the restoration of Ballona Wetlands and want to see it happen ASAP, starting with the release of the EIR/EIS, please sign our petition now.

You can also contact CDFW and your federal elected officials to let them know that you care about wetland habitat and that you want to see the EIR/EIS now.

SIGN THE PETITION FOR A BALLONA WETLANDS EIR

Learn more about the Ballona Wetlands.

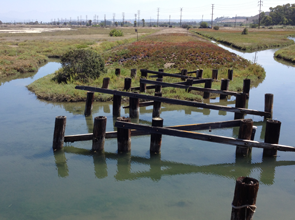
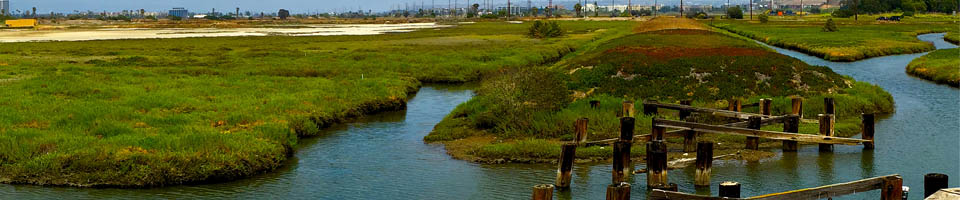
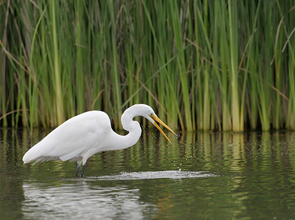
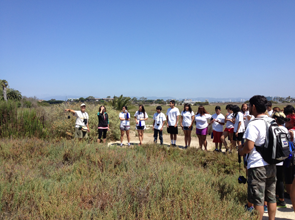
White egret at the Ballona Wetlands Student group on a tour at Ballona Wetlands Wooden posts at Ballona Wetlands


Sept. 17, 2016 — There are 8 million stories in the trashy city on Coastal Cleanup Day. Here is one of them from Heal the Bay’s communications director, Matthew King.

Heading down PCH to infamous Lunada Bay this morning, I really didn’t know what to expect.

To Southern California surfers, this idyllic cove in Palos Verdes Estates is infamous for being home to the Bay Boys, a group of largely middle-aged locals accused of using vigilante-like tactics to scare away visitors. These self-appointed regulators sit on the bluffs and regularly block access to the beach, according to a recently filed federal class-action lawsuit, all in the name of keeping some of L.A.’s best waves to themselves.

After years of hosting cleanups up and down the Palos Verdes Estates, Heal the Bay decided to host a site at Lunada Bay in concert with city staff for this year’s Coastal Cleanup Day. Leading up to the cleanup, I hadn’t given the site much thought. Then I received a few media enquiries asking about the Bay Boys and if we expected any trouble or were taking any safety precautions.

It all seemed a bit alarmist to me. But I do have some family history at Lunada Bay that gave me some pause. Last fall, my high school son and his friends – unbeknownst to me – decided to hike down to the cove to watch the sunset. They came back to find the tires slashed on their car.

Channeling the sage words of my colleague Meredith McCarthy, I assured the journalists that cleanups tend to bring out the best in people. We didn’t expect any trouble, I said (and hoped).

As usual, Meredith was right.

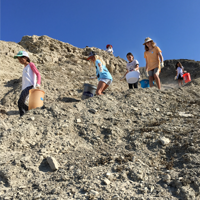
Volunteers climbing down to Lunada BayI spent a beautiful morning with about two dozen volunteers at Lunada. The only intimidation I felt this day was figuring out how to navigate the twisting, semi-treacherous path to the beach without falling on my butt. And the only locals I crossed paths with were an adorable group of girls volunteering from Lunada Bay Elementary School across the street. They weren’t too menacing.
The rocky shoreline is thankfully free of the micro-trash that plagues most Southland beaches: cigarette butts and whatnot. The biggest haul came from beer cans and plastic water bottles chucked carelessly from the bluffs. An intrepid group of Palos Verdes High students scurried up the cliffs like billy goats to retrieve trash, while their proud mothers beamed on the beach. The group was part of the Los Hermanos Black club, which organizes volunteer opportunities for mothers and their teen-aged sons.

Including the Lunada volunteers, the Cleanup Day crew in L.A. County totaled 9,556 people at 48 inland and coastal sites. Participants hauled in 29,635 pounds of ocean-bound debris. This year’s group collected nearly 30% more trash in L.A. County than last year’s volunteers. (You can view that as either a positive or negative, I suppose!) Among the items found: a switchblade knife, a flight-deck crew vest from an aircraft carrier, two old TVs, three syringes, nine shopping carts and one human-sized teddy bear on the sands of Long Beach.

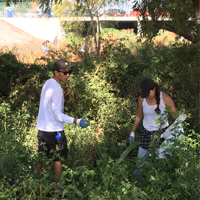
A couple of volunteers at Compton CreekOn my way home, I detoured to another one of my favorite sites — Compton Creek, a largely forgotten gem in the necklace of green spaces along the L.A. River.
This tributary is one of the few soft-bottomed portions of the largely channelized L.A. River. A half-mile stretch of lush vegetation sits hard against the Crystal Hotel and Casino, surrounded by concrete and the 91 Freeway. The creek is choked with trash and polluted runoff fouls its waters, but life miraculously thrives here. Turtles scour the muddy bottom, while herons alight in the brush, looking for tiny morsels.

Nearly 100 volunteers donned gloves and trudged through the boggy waters, hauling out a depressing mix of fast-food wrappers, plastic bags and food packaging. To be honest, if I were a volunteer I would view collecting all that trash as a Sisyphean task. I’d wonder if I had made a dent. We could’ve sent 1,000 people to that spot today and we still wouldn’t have been able to remove all the annoying bits of chip bags and Styrofoam containers ground into the creek bank.

Yet participants remain so optimistic. A Filipino service fraternity called Alpha Phi Omega sent a squadron of volunteers to Compton this morning. One gentlemen, with a full bag of trash, smiled broadly as I approached him. Seeing my Heal the Bay T-shirt, he thanked me.

After participating in dozens of cleanups in my tenure here, it’s easy to get blasé sometimes. I wonder what in the world motivates people to get up on their Saturday off and pick up trash for nothing. I know we absolutely cannot function without our volunteers, but his smile reminded me that we give as much as we get by organizing Coastal Cleanup Day. Volunteers leave feeling hopeful, feeling good about themselves and their communities.

Meredith was right … again.

Check out the photos of Coastal Cleanup Day sites all over L.A. on our Flickr album.

And a special thanks to this year’s sponsors: Cancer Treatment Centers of America, City of Culver City, City of Santa Monica, California Coastal Conservancy, Disney, KTLA 5, L.A. County Public Works, and Union Bank!


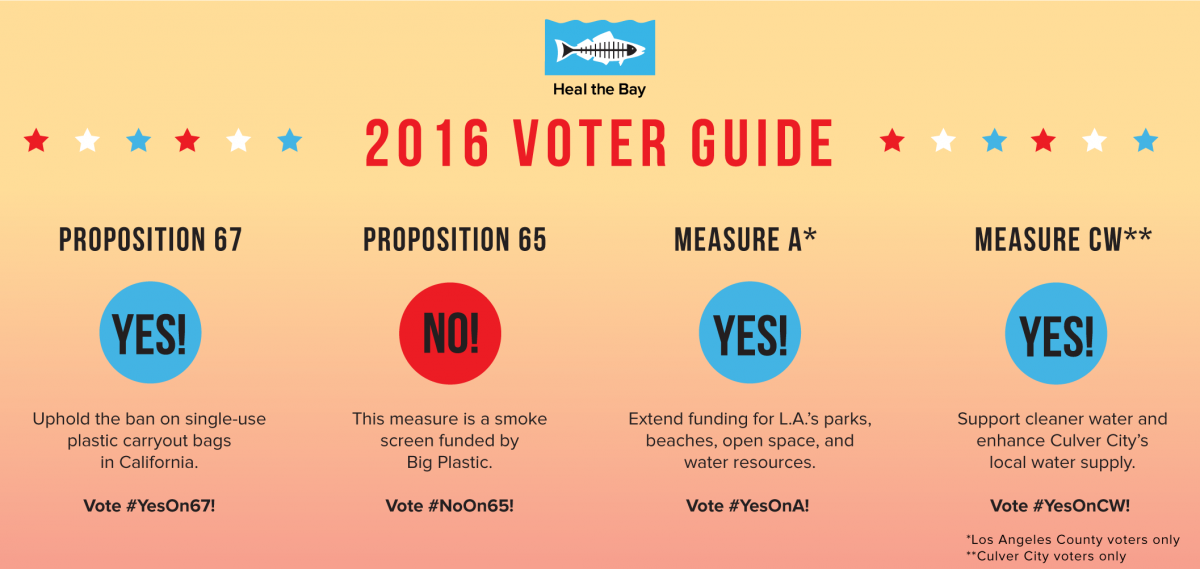
September 16, 2016 — There’s a record-breaking number of propositions on California’s general election ballot this year. We created this voter guide to help make your trip to the polls as painless as possible. On November 8 (or earlier, if you’re voting by mail), cast your votes with confidence and remember to Vote Blue!

Heal the Bay's 2016 Voter Guide


Proposition 67: A vote to uphold the ban on single-use plastic carryout bags in California.

The issue: California became the first state in the nation in 2014 to enact plastic bag ban legislation through SB 270, which prohibits grocery stores, convenience stores, and pharmacies from distributing single-use plastic bags, and requires stores to charge a minimum of 10 cents for paper bags. The plastics industry has spent more than $6 million in attempt to overturn California’s plastic bag ban by delaying its implementation by placing this item on the November ballot.

The stakes: Designed for minutes of use, plastic bags do not break down in the environment, and pose a large threat to aquatic life. Over 663 species of marine life have been impacted by ingestion of or entanglement in plastic pollution. By 2050, scientists project that plastic pollution will outweigh fish in our oceans. These lightweight plastic bags also blight our communities and are costly to clean-up. California spends up to $107 million each year managing plastic bag litter.

Our recommendation: Cast your ballot for cleaner beaches and neighborhoods. Vote YES.


Proposition 65: A rival measure to Prop 67 funded by Big Plastic. 

The issue: Prop 65 will deliver little for the environment. It was placed on the ballot by out-of-state plastic bag companies who keep interfering with California’s efforts to reduce plastic pollution. Prop 65 is designed to distract from the environmental priority of defending the state’s plastic bag ban. All Prop 65 would do is direct money from the sale of paper bags to a vaguely defined environmental fund administered by the state.

The stakes: The sole purpose of Prop 65 is to confuse voters. It would only serve the interests of plastic bag companies and would distract from phasing out plastic bags entirely. Prop 65 also fuels the tired paper vs. plastic debate. The real issue is reducing the overall use of single-use bags – be they paper or plastic.

Our recommendation: Prop 65 is a smoke screen. Vote NO.


Measure A*: Safe, clean neighborhood parks and beaches measure of 2016.

The issue: Measure A asks voters to continue their support for local parks, beaches, open space, and water resources by approving an annual parcel tax of 1.5 cents per square foot of development. If approved, the estimated tax for the owner of a 1,500 square foot home will be $22.50 per year, and will be included on the annual property tax bill.  Generating approximately $94 million per year for our local parks, beaches, and open space areas, Measure A will replace expiring dedicated funding from the voter-approved Propositions A of 1992 and 1996.

The stakes: For more than 20 years, our communities have relied on local, voter-approved funding from the Los Angeles County Safe Neighborhood Parks Acts of 1992 and 1996 (Proposition A) to protect and maintain our neighborhood parks, outdoor areas and water resources. However, funding from the 1992 Proposition A ended in 2015 and funding from the 1996 Proposition will end in 2019.

Our recommendation: Updating park infrastructure makes our region more resilient. Vote YES.


Ballot Measure CW**: Funding support for stormwater capture and reuse projects in Culver City. 

The issue: Cities in LA County are required by the Regional Water Quality Control Board to manage pollution from urban runoff flowing through their systems. However, since stormwater services, unlike our other essential utilities, have minimal and in some cases no fees to support them, funding for fulfilling these requirements falls far short of the need. Culver City’s ballot measure would establish fees on property owners to support the stormwater projects the City is required by regulation to complete.

The stakes: Urban runoff is the number one source of pollution to our rivers, lakes and ocean. In addition, losing that volume, which can reach millions of gallons even on a dry day throughout LA County, to the ocean is a wasted opportunity that we can’t afford, especially in the midst of a drought. The proposed fee would support projects that would reduce urban runoff pollution from reaching our waterways, and where possible capture and reuse that water.

Our recommendation: Support cleaner waterways and more local water supply. Vote YES.


*Los Angeles County voters only.

**Culver City voters only.


Got election questions? Not sure when/where/how/if to vote? Visit the Secretary of State’s election FAQ page.


For 2017 grades, please see our River Report Card.

Heal the Bay’s inaugural study of Los Angeles River microbial water quality that we published July 27, 2016 and last year’s study on swimming holes in the Santa Monica Mountains called for more readily available public water quality information. The public has a right to know about water quality conditions in these freshwater recreation areas so that they can make informed decisions on how to minimize the risk of getting sick.

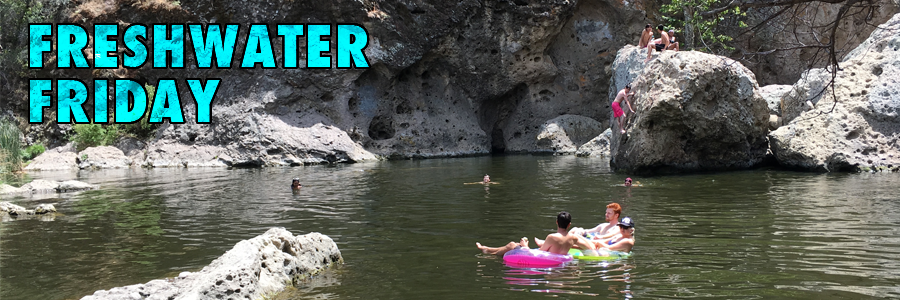
We will be posting an update every Friday during the summer with water quality information from our weekly sampling of freshwater recreation sites in Los Angeles County.

Malibu Creek State Park – Number of Exceedances
Site Name 9/29/16 9/21/16 9/15/16 9/7/16 8/31/16 8/24/16 8/17/16 8/10/16 8/3/16
Rock Pool 0 out of 4

None of the four criteria exceed the threshold values this week at Rock Pool site in Malibu Creek. The single sample E. coli value was below the threshold of 235 MPN/100ml, and the geometric mean for E. coli was below 126 MPN/100ml. The single sample Enterococcus value was also below the threshold of 110 MPN/100ml as was the geometric mean value for Enterococcus (below 30 MPN/100ml). Since June 15, 2016, we have documented exceedance rates (for single samples) of 20% for E. coli and 13% for Enterococcus at this site.
0 out of 4

None of the four criteria exceed the threshold values this week at Rock Pool site in Malibu Creek. The single sample E. coli value was below the threshold of 235 MPN/100ml, and the geometric mean for E. coli was below 126 MPN/100ml. The single sample Enterococcus value was also below the threshold of 110 MPN/100ml as was the geometric mean value for Enterococcus (below 30 MPN/100ml). Since June 15, 2016, we have documented exceedance rates (for single samples) of 21% for E. coli and 14% for Enterococcus at this site.
0 out of 4

None of the four criteria exceed the threshold values this week at Rock Pool site in Malibu Creek. The single sample E. coli value was below the threshold of 235 MPN/100ml, and the geometric mean for E. coli was below 126 MPN/100ml. The single sample Enterococcus value was also below the threshold of 110 MPN/100ml as was the geometric mean value for Enterococcus (below 30 MPN/100ml). Since June 15, 2016, we have documented exceedance rates (for single samples) of 23% for E. coli and 15% for Enterococcus at this site.
1 out of 4

Only one of the four criteria exceeds the threshold values this week at Rock Pool site in Malibu Creek. The single sample E. coli value was below the threshold of 235 MPN/100ml, and the geometric mean for E. coli was below 126 MPN/100ml. The single sample Enterococcus value was also below the threshold of 110 MPN/100ml but the geometric mean value for Enterococcus was over the threshold of 30 MPN/100ml. Since June 15, 2016, we have documented exceedance rates (for single samples) of 25% for E. coli and 17% for Enterococcus at this site.
1 out of 4

Only one of the four criteria exceeds the threshold values this week at Rock Pool site in Malibu Creek. The single sample E. coli value was below the threshold of 235 MPN/100ml, and the geometric mean for E. coli was below 126 MPN/100ml. The single sample Enterococcus value was also below the threshold of 110 MPN/100ml but the geometric mean value for Enterococcus was over the threshold of 30 MPN/100ml. Since June 15, 2016, we have documented exceedance rates (for single samples) of 27% for E. coli and 18% for Enterococcus at this site.
2 out of 4

Two of the four criteria exceed the threshold values this week at Rock Pool site in Malibu Creek. The single sample E. coli value was below the threshold of 235 MPN/100ml, and the geometric mean for E. coli was below 126 MPN/100ml. In contrast, both the single sample and geometric mean values for Enterococcus were over their respective thresholds. Since June 15, 2016, we have documented exceedance rates (for single samples) of 30% for E. coli and 20% for Enterococcus at this site.
1 out of 4

One of the four criteria exceeds the threshold values this week at Rock Pool site in Malibu Creek. For both E. coli and Enterococcus, the single sample values were under their respective thresholds. The geometric mean value for E. coli was under its threshold, while Enterococcus was over its threshold. Since June 15, 2016, we have documented exceedance rates (for single samples) of 33% for E. coli and 11% for Enterococcus at this site.
2 out of 4

Two of the four criteria exceed the threshold values this week at Rock Pool site in Malibu Creek. For both E. coli and Enterococcus, the single sample values were under their respective thresholds but the geometric mean values were over the thresholds. Since June 15, 2016, we have documented exceedance rates (for single samples) of 33% for E. coli and 12% for Enterococcus at this site.
3 out of 4

Three of the four criteria exceed the threshold values this week at Rock Pool site in Malibu Creek. For E. coli, the single sample and geometric mean values were over threshold values; the single sample Enterococcus value was under the threshold of 110 MPN/100ml but the geometric mean value was over the threshold value. Since June 15, 2016, we have documented exceedance rates (for single samples) of 43% for E. coli and 14% for Enterococcus at this site.
Las Virgenes Creek at the Bridge 1 out of 4

Only one of the four criteria exceed the threshold values this week at Las Virgenes Creek at the bridge. The single sample E. coli value was below the threshold of 235 MPN/100ml, and the geometric mean for E. coli was below 126 MPN/100ml. The single sample Enterococcus value was also below the threshold of 110 MPN/100ml but the geometric mean value for Enterococcus was over the threshold of 30 MPN/100ml. Since June 15, 2016, we have documented exceedance rates (for single samples) of 27% for E. coli and 53% for Enterococcus at this site.
3 out of 4

Three of the four criteria exceed the threshold values this week at Las Virgenes Creek at the bridge. The single sample E. coli value was below the threshold of 235 MPN/100ml but the geometric mean value for E. coli was over the threshold of 126 MPN/100ml.The single sample Enterococcus value was over the threshold of 110 MPN/100ml and the geometric mean value for Enterococcus was over the threshold of 30 MPN/100ml. Since June 15, 2016, we have documented exceedance rates (for single samples) of 29% for E. coli and 57% for Enterococcus at this site.
2 out of 4

Two of the four criteria exceed the threshold values this week at Las Virgenes Creek at the bridge. The single sample E. coli value was below the threshold of 235 MPN/100ml but the geometric mean value for E. coli was over the threshold of 126 MPN/100ml.The single sample Enterococcus value was below the threshold of 110 MPN/100ml but the geometric mean value for Enterococcus was over the threshold of 30 MPN/100ml. Since June 15, 2016, we have documented exceedance rates (for single samples) of 31% for E. coli and 54% for Enterococcus at this site.
2 out of 4

Two of the four criteria exceed the threshold values this week at Las Virgenes Creek at the bridge. The single sample E. coli value was below the threshold of 235 MPN/100ml but the geometric mean value for E. coli was over the threshold of 126 MPN/100ml.The single sample Enterococcus value was below the threshold of 110 MPN/100ml but the geometric mean value for Enterococcus was over the threshold of 30 MPN/100ml. Since June 15, 2016, we have documented exceedance rates (for single samples) of 33% for E. coli and 58% for Enterococcus at this site.
3 out of 4

Three of the four criteria exceed the threshold values this week at Las Virgenes Creek at the bridge. The single sample and geometric mean values for E. coli value were both over their respective thresholds of 235 MPN/100ml and 126 MPN/100ml. The single sample Enterococcus value was below the threshold of 110 MPN/100ml but the geometric mean value for Enterococcus was over the threshold of 30 MPN/100ml. Since June 15, 2016, we have documented exceedance rates (for single samples) of 36% for E. coli and 64% for Enterococcus at this site.
3 out of 4

Three of the four criteria exceed the threshold values this week at Las Virgenes Creek at the bridge. The single sample E. coli value was below the threshold of 235 MPN/100ml, while the geometric mean for E. coli was over 126 MPN/100ml. Both the single sample and geometric mean values for Enterococcus were over their respective thresholds. Since June 15, 2016, we have documented exceedance rates (for single samples) of 30% for E. coli and 70% for Enterococcus at this site.
4 out of 4

Four of the four criteria exceed the threshold values this week at Las Virgenes Creek at the bridge. The single sample E. coli value was above the threshold of 235 MPN/100ml, and the geometric mean for E. coli was over 126 MPN/100ml. Similarly, both the single sample and geometric mean values for Enterococcus were over their respective thresholds. Since June 15, 2016, we have documented exceedance rates (for single samples) of 33% for E. coli and 67% for Enterococcus at this site.
3 out of 4

Three of the four criteria exceed the threshold values this week at Las Virgenes Creek at the bridge. The single sample E. coli value was below the threshold of 235 MPN/100ml but the geometric mean for E. coli was over 126 MPN/100ml, and both the single sample and geometric mean values for Enterococcus were over their respective thresholds. Since June 15, 2016, we have documented exceedance rates (for single samples) of 25% for E. coli and 62% for Enterococcus at this site.
3 out of 4

Three of the four criteria exceed the threshold values this week at Las Virgenes Creek at the bridge. The single sample E. coli value was below the threshold of 235 MPN/100ml but the geometric mean for E. coli was over 126 MPN/100ml, and both the single sample and geometric mean values for Enterococcus were over their respective thresholds. Since June 15, 2016, we have documented exceedance rates (for single samples) of 29% for E. coli and 57% for Enterococcus at this site.
Los Angeles River – Number of Exceedances
Site Name 9/27/16 9/20/16 9/13/16 9/6/16 8/30/16 8/23/16
Steelhead Park, Elysian Valley 1 out of 4

Only one of the four criteria exceeds the threshold values this week at the Steelhead Park site for the Los Angeles River. The single sample E. coli value was below the threshold of 235 MPN/100ml, and the geometric mean for E. coli was below 126 MPN/100ml. The single sample Enterococcus value was also below the threshold of 110 MPN/100ml but the geometric mean value for Enterococcus was over the threshold of 30 MPN/100ml. Since May 31, 2016, we have documented exceedance rates (for single samples) of 6% for E. coli and 61% for Enterococcus at this site.
1 out of 4

Only one of the four criteria exceeds the threshold values this week at the Steelhead Park site for the Los Angeles River. The single sample E. coli value was below the threshold of 235 MPN/100ml, and the geometric mean for E. coli was below 126 MPN/100ml. The single sample Enterococcus value was also below the threshold of 110 MPN/100ml but the geometric mean value for Enterococcus was over the threshold of 30 MPN/100ml. Since May 31, 2016, we have documented exceedance rates (for single samples) of 6% for E. coli and 65% for Enterococcus at this site.
1 out of 4

Only one of the four criteria exceeds the threshold values this week at the Steelhead Park site for the Los Angeles River. The single sample E. coli value was below the threshold of 235 MPN/100ml, and the geometric mean for E. coli was below 126 MPN/100ml. The single sample Enterococcus value was also below the threshold of 110 MPN/100ml but the geometric mean value for Enterococcus was over the threshold of 30 MPN/100ml. Since May 31, 2016, we have documented exceedance rates (for single samples) of 6% for E. coli and 69% for Enterococcus at this site.
1 out of 4

Only one of the four criteria exceeds the threshold values this week at the Steelhead Park site for the Los Angeles River. The single sample E. coli value was below the threshold of 235 MPN/100ml, and the geometric mean for E. coli was below 126 MPN/100ml. The single sample Enterococcus value was also below the threshold of 110 MPN/100ml but the geometric mean value for Enterococcus was over the threshold of 30 MPN/100ml. Since May 31, 2016, we have documented exceedance rates (for single samples) of 7% for E. coli and 73% for Enterococcus at this site.
2 out of 4

Two of the four criteria exceed the threshold values this week at the Steelhead Park site for the Los Angeles River. The single sample E. coli value was below the threshold of 235 MPN/100ml, and the geometric mean for E. coli was below 126 MPN/100ml. In contrast, both the single sample and geometric mean values for Enterococcus were over their respective thresholds (110 and 30 MPN/100ml). Since May 31, 2016, we have documented exceedance rates (for single samples) of 7% for E. coli and 79% for Enterococcus at this site.
2 out of 4

Two of the four criteria exceed the threshold values this week at the Steelhead Park site for the Los Angeles River. The single sample E. coli value was below the threshold of 235 MPN/100ml, and the geometric mean for E. coli was below 126 MPN/100ml. In contrast, both the single sample and geometric mean values for Enterococcus were over their respective thresholds. Since May 31, 2016, we have documented exceedance rates (for single samples) of 8% for E. coli and 77% for Enterococcus at this site.
Rattlesnake Park, Elysian Valley 3 out of 4

Three of the four criteria exceed the threshold values this week at the Rattlesnake Park site for the Los Angeles River. The single sample value for E. coli was below the threshold of 235 MPN/100ml, but the geometric mean for E. coli was over the threshold of 126 MPN/100ml. Both the single sample and geometric mean values for Enterococcus were also over their respective thresholds (110 and 30 MPN/100ml). Since May 31, 2016, we have documented exceedance rates (for single samples) of 50% for E. coli and 100% for Enterococcus at this site.
4 out of 4

All four of the criteria exceed the threshold values this week at the Rattlesnake Park site for the Los Angeles River. The single sample and geometric mean values for E. coli value were above the thresholds of 235 and 126 MPN/100ml, respectively. Both the single sample and geometric mean values for Enterococcus were also over their respective thresholds (110 and 30 MPN/100ml). Since May 31, 2016, we have documented exceedance rates (for single samples) of 53% for E. coli and 100% for Enterococcus at this site.
4 out of 4

All four of the criteria exceed the threshold values this week at the Rattlesnake Park site for the Los Angeles River. The single sample and geometric mean values for E. coli value were above the thresholds of 235 and 126 MPN/100ml, respectively. Both the single sample and geometric mean values for Enterococcus were also over their respective thresholds (110 and 30 MPN/100ml). Since May 31, 2016, we have documented exceedance rates (for single samples) of 50% for E. coli and 100% for Enterococcus at this site.
3 out of 4

Three of the four criteria exceed the threshold values this week at the Rattlesnake Park site for the Los Angeles River. The single sample E. coli value was below the threshold of 235 MPN/100ml, but the geometric mean for E. coli was over 126 MPN/100ml. Both the single sample and geometric mean values for Enterococcus were over their respective thresholds (110 and 30 MPN/100ml). Since May 31, 2016, we have documented exceedance rates (for single samples) of 47% for E. coli and 100% for Enterococcus at this site.
3 out of 4

Three of the four criteria exceed the threshold values this week at the Rattlesnake Park site for the Los Angeles River. The single sample E. coli value was below the threshold of 235 MPN/100ml, but the geometric mean for E. coli was over 126 MPN/100ml. Both the single sample and geometric mean values for Enterococcus were over their respective thresholds (110 and 30 MPN/100ml). Since May 31, 2016, we have documented exceedance rates (for single samples) of 50% for E. coli and 100% for Enterococcus at this site.
4 out of 4

Four of the four criteria exceed the threshold values this week at the Rattlesnake Park site for the Los Angeles River. The single sample E. coli value was above the threshold of 235 MPN/100ml, and the geometric mean for E. coli was over 126 MPN/100ml. Similarly, both the single sample and geometric mean values for Enterococcus were over their respective thresholds. Since May 31, 2016, we have documented exceedance rates (for single samples) of 54% for E. coli and 100% for Enterococcus at this site.
Sepulveda Basin at Burbank Blvd. 1 out of 4

Only one of the four criteria exceeds the threshold values this week at the Sepulveda Basin site for the Los Angeles River. The single sample E. coli value was below the threshold of 235 MPN/100ml, and the geometric mean for E. coli was below 126 MPN/100ml. The single sample Enterococcus value was also below the threshold of 110 MPN/100ml but the geometric mean value for Enterococcus was over the threshold of 30 MPN/100ml. Since May 31, 2016, we have documented exceedance rates (for single samples) of 0% for E. coli and 6% for Enterococcus at this site.
1 out of 4

Only one of the four criteria exceeds the threshold values this week at the Sepulveda Basin site for the Los Angeles River. The single sample E. coli value was below the threshold of 235 MPN/100ml, and the geometric mean for E. coli was below 126 MPN/100ml. The single sample Enterococcus value was also below the threshold of 110 MPN/100ml but the geometric mean value for Enterococcus was over the threshold of 30 MPN/100ml. Since May 31, 2016, we have documented exceedance rates (for single samples) of 0% for E. coli and 6% for Enterococcus at this site.
1 out of 4

Only one of the four criteria exceeds the threshold values this week at the Sepulveda Basin site for the Los Angeles River. The single sample E. coli value was below the threshold of 235 MPN/100ml, and the geometric mean for E. coli was below 126 MPN/100ml. The single sample Enterococcus value was also below the threshold of 110 MPN/100ml but the geometric mean value for Enterococcus was over the threshold of 30 MPN/100ml. Since May 31, 2016, we have documented exceedance rates (for single samples) of 0% for E. coli and 6% for Enterococcus at this site.
1 out of 4

Only one of the four criteria exceeds the threshold values this week at the Sepulveda Basin site for the Los Angeles River. The single sample E. coli value was below the threshold of 235 MPN/100ml, and the geometric mean for E. coli was below 126 MPN/100ml. The single sample Enterococcus value was also below the threshold of 110 MPN/100ml but the geometric mean value for Enterococcus was over the threshold of 30 MPN/100ml. Since May 31, 2016, we have documented exceedance rates (for single samples) of 0% for E. coli and 7% for Enterococcus at this site.
1 out of 4

Only one of the four criteria exceeds the threshold values this week at the Sepulveda Basin site for the Los Angeles River. The single sample E. coli value was below the threshold of 235 MPN/100ml, and the geometric mean for E. coli was below 126 MPN/100ml. The single sample Enterococcus value was also below the threshold of 110 MPN/100ml but the geometric mean value for Enterococcus was over the threshold of 30 MPN/100ml. Since May 31, 2016, we have documented exceedance rates (for single samples) of 0% for E. coli and 7% for Enterococcus at this site.
2 out of 4

Two of the four criteria exceed the threshold values this week at the Sepulveda Basin site for the Los Angeles River. The single sample E. coli value was below the threshold of 235 MPN/100ml, and the geometric mean for E. coli was below 126 MPN/100ml. In contrast, both the single sample and geometric mean values for Enterococcus were over their respective thresholds. Since May 31, 2016, we have documented exceedance rates (for single samples) of 0% for E. coli and 8% for Enterococcus at this site.

We envision safe swimmable rivers and creeks throughout Los Angeles County. However, a number of recreational waterbodies are not regularly monitored or monitored at all. We know thousands of Angelenos use these aquatic resources.

As such, Heal the Bay would rather provide some information about the water quality they are immersing themselves into rather than no information. The idea is to prompt the user to ask questions about these waterbodies: What is the origin of the water? Can I get sick from it? What types of illnesses can I get? How do I get more information? Check out the answers to these questions and more in our FAQ and the joint statement on recreation in the L.A. River.

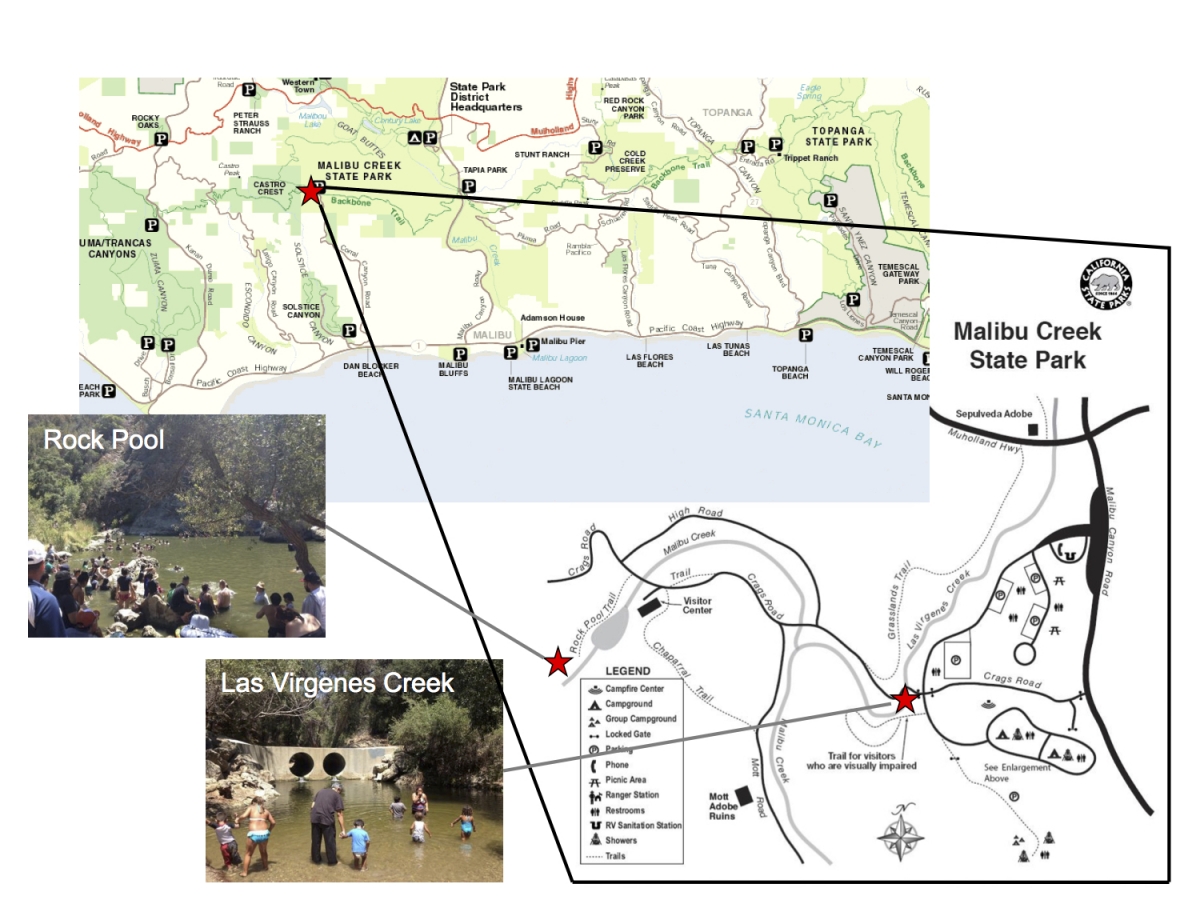
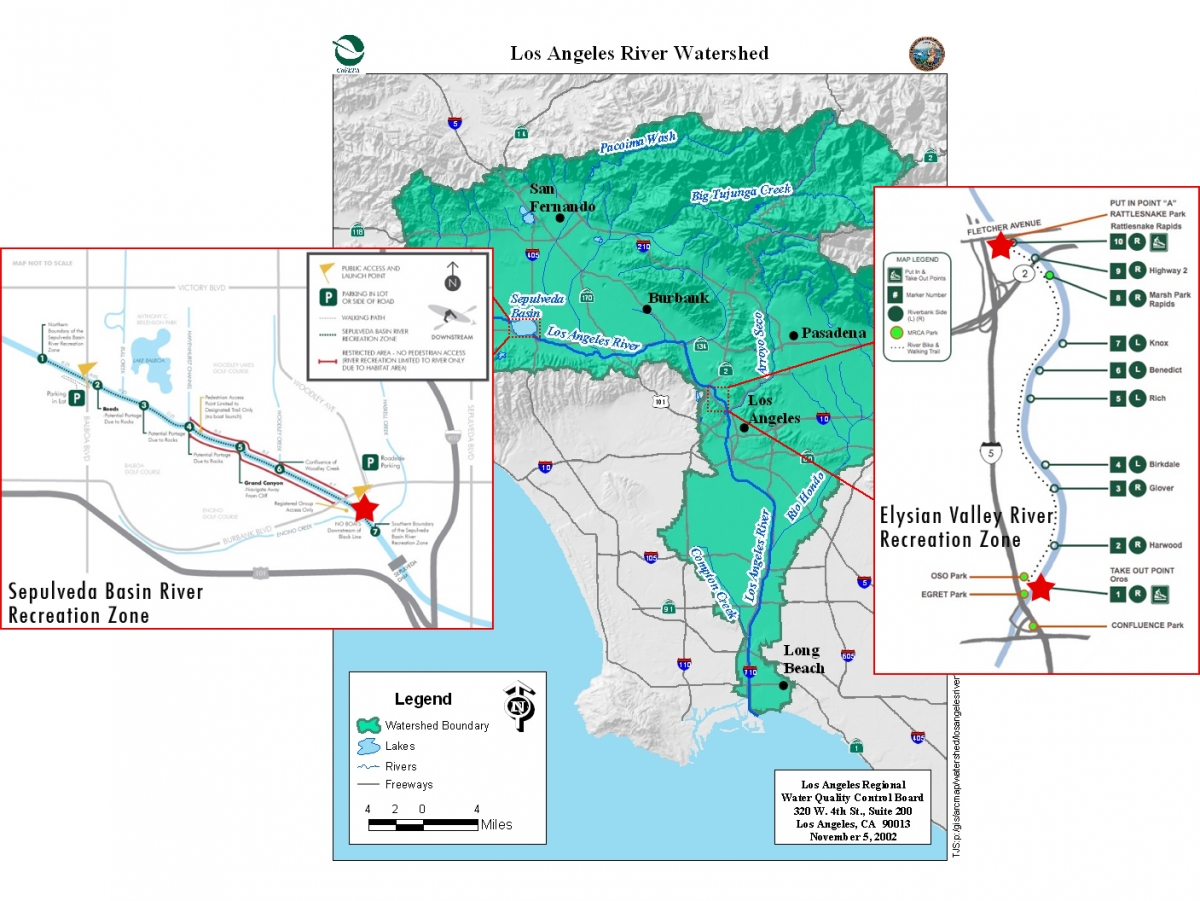
Malibu Creek State Park testing sites mapL.A. River testing sites map

Heal the Bay has been monitoring water quality in streams and rivers since 1998 through our Stream Team program. In 2014 we initiated a pilot study to monitor human use and water quality at freshwater swimming spots in the Santa Monica Mountains, focusing on bacterial pollution and public health implications. We are currently in our third summer of monitoring water quality in those swimming locations. Given Heal the Bay’s 25-year history of informing and educating beachgoers about beach water quality through our Beach Report Card, assessing the water quality of the Los Angeles River recreation zones was a natural next step. We are now in our second season of monitoring for the L.A. River recreation zones.

The A-to-F grading system of the Beach Report Card took years of work to develop and fine-tune. We are only in the very early stages of thinking about an analogous River Report Card. But we want to start by making basic water quality information available to the public in a timely manner.

We will be providing weekly information about levels of fecal indicator bacteria at five sites. We will report on whether the sample from the current week exceeded limits set by the Regional Water Quality Control Board and US EPA and what the microbial water quality has been over the summer sampling season thus far.

We will report on two types of fecal indicator bacteria, or FIB: E. coli and Enterococcus. FIB, while not harmful themselves, indicate the possible presence of pathogenic bacteria, which have been found to cause ear infections, skin rashes, respiratory illnesses and gastrointestinal illness. High levels of FIB are particularly concerning in areas where people come in contact with water through activities like swimming, fishing, and kayaking.

Excuse us for getting technical in this next section, but we just want to be clear about what we are measuring and what constitutes an exceedance.

We compare bacteria levels measured at each site to water quality objectives from the Total Maximum Daily Loads (TMDL) for Bacteria in the Malibu Creek Watershed and the Los Angeles River Watershed as well as EPA’s 2012 Recreational Water Quality Criteria (RWQC)

The freshwater regulatory limit for E. coli is set in the TMDL at 235 MPN/100ml for a single sample and 126 MPN/100ml for the geometric mean. (A geometric mean is a type of average that results in a number that is not as heavily affected by very high or very low values).

We calculate geometric means from all samples over the last 30-day period (usually four or five samples). For Enterococcus, we used EPA’s statistical threshold value for an illness rate of 32/1,000 (the more protective rate), which is 110 MPN/100ml for a single sample and 30 MPN/100ml for the geometric mean in a fresh waterbody designated for recreation.

For each site, we will report on the number of criteria that exceeded four standards. A site can have 0-4 out of four exceedances. A sample exceeds if:

  • E. coli single sample > 235 MPN/100ml
  • E. coli geometric mean > 126 MPN/100ml
  • Enterococcus single sample is > 110 MPN/100ml
  • Enterococcus geometric mean is > 30 MPN/100ml

So, what does that all mean?

The greater the number and magnitude of exceedances at a site, the worse the water quality is, indicating a potentially increased risk of getting sick.

Deciding what to do with this information depends on the risk level you are comfortable with. Single sample values give you an indication of the most recent water quality, while geometric mean values give you an indication of the ambient water quality over the last 30 days.

However, it is important to note that the single sample gives information for the day on which the sample was taken and conditions can change throughout the week until the next sample is taken.

The thresholds that the US EPA and the RWQCB have put forth are based on epidemiological studies and risk. An increased risk of illness is not a guarantee that you will get sick. Certain activities are more risky when water quality is poor; for instance, swimming and submerging your head is more risky than wading; swimming is more risky than kayaking; kayaking is likely more risky than hiking (at least with regards to picking up a waterborne illness), and so on, with the risk dependent on how likely you are to ingest or contact water.

We recommend following these best practices to stay safe and healthy.

  • Swimming: In waters known to exceed bacterial limits, swimming is not recommended, particularly submerging one’s head. Elevated bacteria levels can occur at any time. Swimmers should use caution when entering the water by checking the latest water quality results, avoiding contact immediately after a rainfall, if they are immunocompromised, or if they have an open wound. If there is any water contact, then rise off with soap and water afterward.
  • Kayaking and Fishing: In waters that are known to exceed bacterial limits, people should limit water contact, especially avoiding hand-to-face water contact. Users should not enter the water with an open wound, if immunocompromised, or after a rainfall. If there is any water contact, then rinse off with soap and water afterward.


Aug, 5, 2016 — Staff scientist Katherine Pease launches our Freshwater Friday blog post, providing weekly updates on the latest bacterial exceedances at popular recreational zones

Heal the Bay’s inaugural study of Los Angeles River microbial water quality that we published last week and last year’s study on swimming holes in the Santa Monica Mountains called for more readily available public water quality information. The public has a right to know about water quality conditions in these freshwater recreation areas so that they can make informed decisions on how to minimize the risk of getting sick.

So beginning today with our Santa Monica Mountains sites, we will be posting a blog post every Friday during the summer with water quality information from our weekly sampling of freshwater recreation sites in Los Angeles County. (You can see this week’s findings at the bottom of this page, but first we want to explain our intent and methodology.)

We envision safe swimmable rivers and creeks throughout Los Angeles County. However, a number of recreational waterbodies are not regularly monitored or monitored at all. We know thousands of Angelenos use these aquatic resources.

As such, Heal the Bay would rather provide some information about the water quality they are immersing themselves into rather than no information. The idea is to prompt the user to ask questions about these waterbodies: What is the origin of the water? Can I get sick from it? What types of illnesses can I get? How do I get more information? We will be posting a Frequently Asked Questions document next week to help answer some of these questions.

Heal the Bay has been monitoring water quality in streams and rivers since 1998 through our Stream Team program. In 2014 we initiated a pilot study to monitor human use and water quality at freshwater swimming spots in the Santa Monica Mountains, focusing on bacterial pollution and public health implications.

The A-to-F grading system of the Beach Report Card took years of work to develop and fine-tune. We are only in the very early stages of thinking about an analogous River Report Card. But we want to start by making basic water quality information available to the public in a timely manner.

We will be providing weekly information about levels of fecal indicator bacteria at five sites. We will report on whether the sample from the current week exceeded limits set by the Regional Water Quality Control Board and US EPA and what the microbial water quality has been over the summer sampling season thus far.

We will report on two types of fecal indicator bacteria, or FIB: E. coli and Enterococcus. FIB, while not harmful themselves, indicate the possible presence of pathogenic bacteria, which have been found to cause ear infections, skin rashes, respiratory illnesses and gastrointestinal illness. High levels of FIB are particularly concerning in areas where people come in contact with water through activities like swimming, fishing, and kayaking.

Excuse us for getting technical in this next section, but we just want to be clear about what we are measuring and what constitutes an exceedance.

We compare bacteria levels measured at each site to water quality objectives from the Total Maximum Daily Loads (TMDL) for Bacteria in the Malibu Creek Watershed and EPA’s 2012 Recreational Water Quality Criteria (RWQC)

The freshwater regulatory limit for E. coli is set in the TMDL at 235 MPN/100ml for a single sample and 126 MPN/100ml for the geometric mean. (A geometric mean is a type of average that results in a number that is not as heavily affected by very high or very low values).

We calculate geometric means from all samples over the last 30-day period (usually four or five samples). For Enterococcus, we used EPA’s statistical threshold value (for an illness rate of 32/1,000 (the more protective rate), which is 110 MPN/100ml for a single sample and 30 MPN/100ml for the geometric mean in a fresh waterbody designated for recreation.

For each site, we will report on the number of criteria that exceeded four standards. A site can have 0-4 out of four exceedances. A sample exceeds if:

E. coli single sample > 235 MPN/100ml 

E. coli geometric mean > 126 MPN/100ml

Enterococcus single sample is > 110 MPN/100ml

Enterococcus geometric mean is > 30 MPN/100ml

So, what does that all mean?

The greater the number and magnitude of exceedances at a site, the worse the water quality is, indicating a potentially increased risk of getting sick.

Deciding what to do with this information depends on the risk level you are comfortable with. Single sample values give you an indication of the most recent water quality, while geometric mean values give you an indication of the ambient water quality over the last 30 days.

However, it is important to note that the single sample gives information for the day on which the sample was taken and conditions can change throughout the week until the next sample is taken.

The thresholds that the US EPA and the RWQCB have put forth are based on epidemiological studies and risk. An increased risk of illness is not a guarantee that you will get sick. Certain activities are more risky when water quality is poor; for instance, swimming and submerging your head is more risky than wading; swimming is more risky than kayaking; kayaking is likely more risky than hiking (at least with regards to picking up a waterborne illness), and so on, with the risk dependent on how likely you are to ingest or contact water.

We recommend following these best practices to stay safe and healthy.

  • Swimming: In waters known to exceed bacterial limits, swimming is not recommended, particularly submerging one’s head. Elevated bacteria levels can occur at any time. Swimmers should use caution when entering the water by checking the latest water quality results, avoiding contact immediately after a rainfall, if they are immunocompromised, or if they have an open wound. If there is any water contact, then rise off with soap and water afterward.
  • Kayaking and Fishing: In waters that are known to exceed bacterial limits, people should limit water contact, especially avoiding hand-to-face water contact. Users should not enter the water with an open wound, if immunocompromised, or after a rainfall. If there is any water contact, then rinse off with soap and water afterward.

Malibu Creek State Park

for the week ending August 3, 2016

1. Rock Pool: Three exceedances

Three of the four criteria exceed the threshold values this week at Rock Pool site in Malibu Creek. For E. coli, the single sample and geometric mean values were over threshold values; the single sample Enterococcus value was under the threshold of 110 MPN/100ml but the geometric mean value was over the threshold value. Since June 15, 2016, we have documented exceedance rates (for single samples) of 43% for E. coli and 14% for Enterococcus at this site.

2. Las Virgenes Creek at the bridge: Three exceedances

Three of the four criteria exceed the threshold values this week at Las Virgenes Creek at the bridge. The single sample E. coli value was below the threshold of 235 MPN/100ml but the geometric mean for E. coli was over 126 MPN/100ml, and both the single sample and geometric mean values for Enterococcus were over their respective thresholds. Since June 15, 2016, we have documented exceedance rates (for single samples) of 29% for E. coli and 57% for Enterococcus at this site.


July 22, 2016 — Science and policy director Rita Kampalath gets to the bottom of the massive sewage spill that made a mess of the L.A. River.

Perfect blue sky, 95 degrees outside … and the beaches are closed??

After years of hard work, Heal the Bay is thankful that the days of sewage fouling our waterways are largely behind us. But we got a bad flashback to the old days this week when an estimated 1.75 million gallons of raw sewage spilled into the L.A. River late Monday and early Tuesday. The spill itself was estimated at 2.5 million gallons, roughly 800,000 gallons of which were captured before they reached the river. A rupture in an aging sewer pipe in the Boyle Heights area had been identified as the likely culprit.

We’ve heard a lot about our nation’s crumbling infrastructure, and L.A. isn’t immune to these issues. But the City of Los Angeles’ decision to invest in sewer upgrades over the past few years has largely paid off.

An estimated investment of $200M per year has resulted in an 85% reduction of sanitary sewer overflows (i.e., sewage spills) since 2000. But when popular shorelines in Long Beach and Seal Beach are closed for days because of a spill, you know a major amount of waste must have been discharged and something had seriously gone wrong.

I wanted to find out more about what could have caused such a catastrophic failure of a major sewer line and what was being done to fix it. So Thursday morning, the City of L.A. Bureau of Sanitation staff graciously offered to give me an up-close-and-personal view of the rupture area.

Site of the bridge demolitionWe pulled up to the site, located where active construction is already going on – the highly publicized demolition of the 6th Street Bridge in Boyle Heights. The immediate rupture area was now cleared of the heavy machinery ever-present during the months-long razing of the iconic bridge, but I could still hear demolition crews working nearby. I couldn’t help but wonder if all this heavy construction nearby might have played a role in the failure of the sewer line.

As we surveyed the damage, City staff explained that the spill was detected following sinkholes that had recently formed in the road, roughly at the intersection of Mission Road and 6th Street. These collapses and the associated debris ruptured and then clogged the massive 60-inch trunk line known as the North Outfall Sewer (NOS), causing a back-up of waste, which, given the volume flowing through the enormous pipe, quickly and unfortunately made it into the river.

With crews working around the clock, a diversion was ultimately put into place to direct sewage around the damaged pipe. Cleanup quickly commenced and is still ongoing.

In the early days after a troubling incident like this, we have at least as many questions as answers. We are urging the City to continue investigating the causes and impacts of the spill. What conditions underground led to the sinkholes? Did the months of construction and associated heavy machinery and demolition play a role? What safeguards were put into place to protect the relatively shallow sewer lines during the demolition? The top of the NOS is only 16 feet below ground.

What sort of controls will be put into place to avoid future spills along our key waterways? And, who will be held accountable for this spill? It is also a keen reminder that we need to continue to invest in our aging infrastructure to avoid incidents like this in the future.

When our region’s famously perfect weather starts to veer towards scorching, people want to take advantage of another enviable asset – our recreational waters. But they need to know a day at the beach isn’t going to make them sick.

Barry Berggren, Rita Kampalath, Brian McCormick, and Adel Hagekhalil
Left to right: Barry Berggren, Rita Kampalath, Brian McCormick, and Adel Hagekhalil

So we commend and thank the authorities in Long Beach and Orange County for making the wise decision to prioritize public health and close the beaches as soon as news of the sewage spill came out. But it’s a shame that on this hot weekend some of our best avenues for relief may be out of commission. As a watchdog of our local waterways, Heal the Bay will continue to track the investigation and follow-up on this massive spill, advocating for appropriate accountability measures and preventative actions to protect our vital rivers and beaches.

Spills are fortunately rare occurrences on the river. But chronic bacterial pollution still plagues some of its popular recreational zones. That’s not good news for the increasing number of people who are now kayaking, swimming and angling in its waters.

My colleague Katherine Pease and her team have been collecting and analyzing water samples along the river for harmful bacteria. Next week she will release the results of her study. Let’s just say that if you care about public health, you will be very interested in its findings. Stay tuned.