
River Report Card Summer 2020 Recap
Luke Ginger, Water Quality Scientist at Heal the Bay, recaps a tough summer for water quality monitoring at LA County’s freshwater recreation areas, and outlines the urgent need for equitable, climate-resilient communities in the face of a health pandemic, extreme heat, unprecedented wildfires, and beyond.
Heal the Bay concludes another summer of freshwater sampling and monitoring with the River Report Card. Over the course of the summer of 2020, we provided inland water-goers with water quality grades for 27 freshwater recreation sites across Los Angeles County, California. This included 5 sites in Malibu Creek State Park and the LA River, where Heal the Bay staff collected water quality samples. We updated grades on a weekly basis and posted them online to be viewed by the public.
Summer 2020 was filled with many challenges that impacted our program. Due to COVID-19, Heal the Bay was unable to hire local college students to monitor water quality at recreation sites and storm drains like in previous years. Instead, Heal the Bay’s permanent staff carried out water sampling. This was a major blow to our program because one of our main goals has always been to provide knowledge, skills, and career training to emerging professionals. Additionally, without a full crew, we sampled fewer recreation sites and storm drains, leaving the public with less information on how to stay safe.
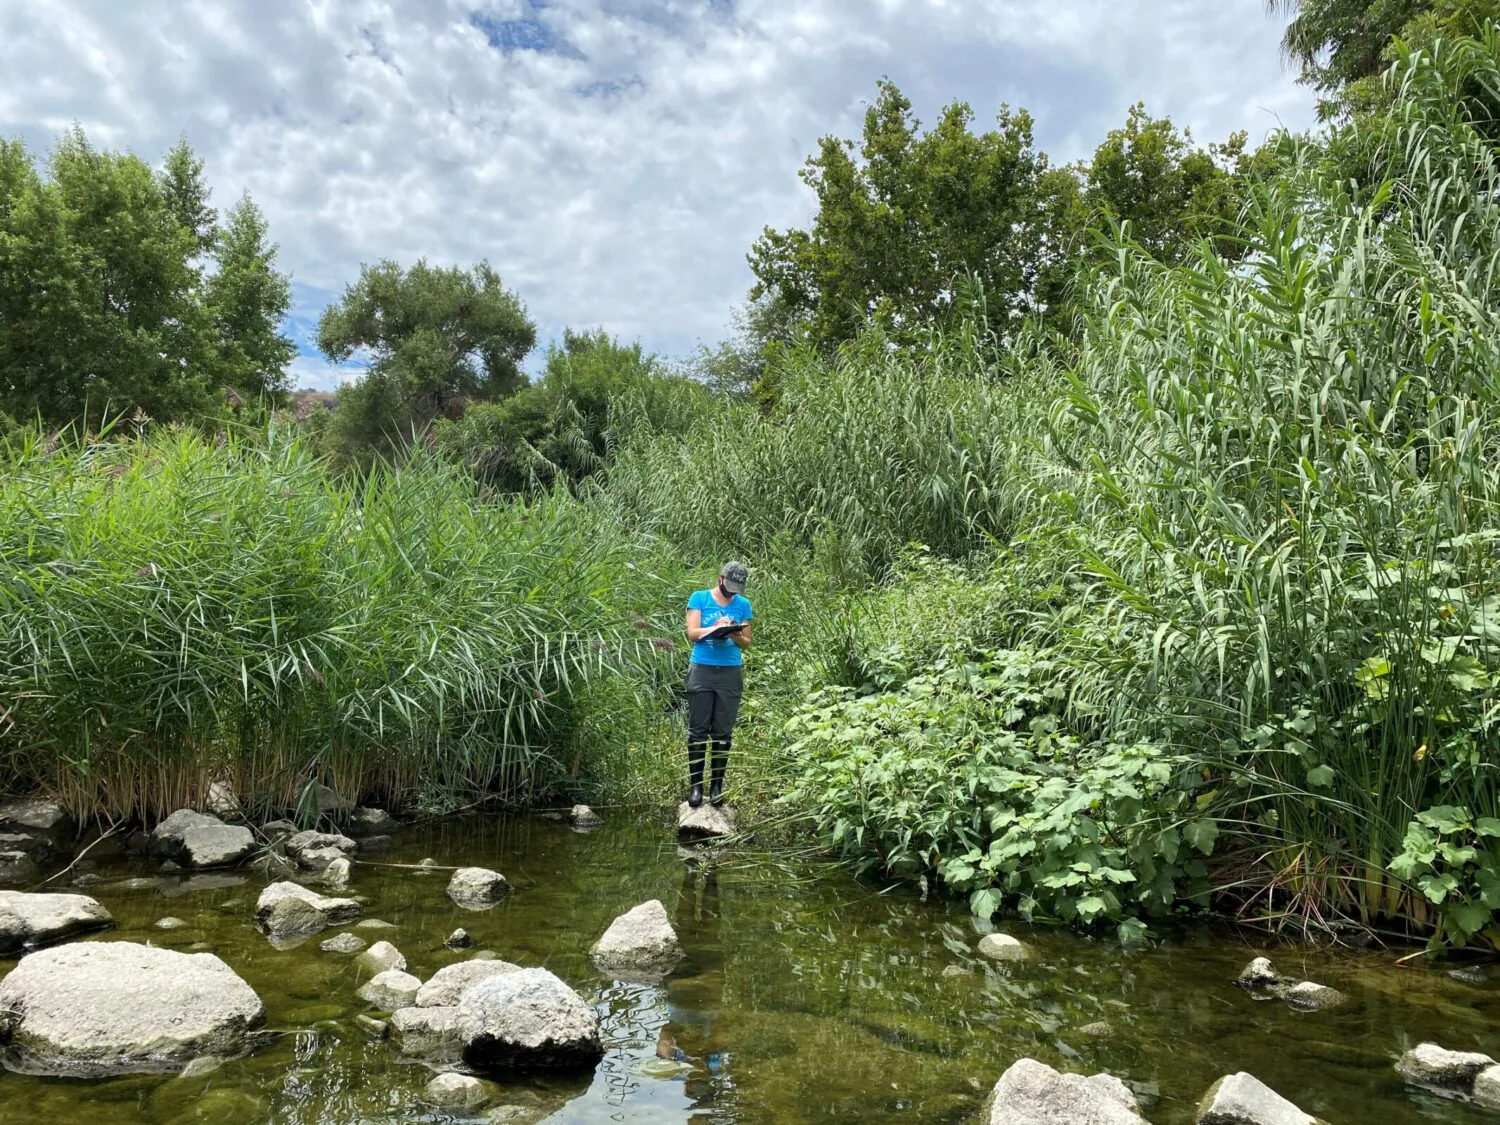
We also had to take extra precautions while sampling – wearing masks at all times, driving in separate vehicles, and sporting extra protective gear (face shields and extra-long gloves) to reduce exposure to potentially contaminated water. These were necessary precautions because the research on the risk of contracting COVID-19 from recreational waters is still ongoing.

Photo by Alice Dison
There were also major changes in accessibility and use this summer at the sites Heal the Bay monitored. Malibu Creek State Park was open all summer, but the swimming holes (Rock Pool and Las Virgenes Creek) remained closed due to concerns over the ability to maintain proper physical distancing. However, this closure was not clearly enforced as we saw many swimmers throughout the summer. The official LA River recreation zones were open from Memorial Day until the end of September, but kayaking was not allowed due to safety concerns around COVID-19.

This summer, the pandemic, a record setting wildfire season, and extreme heat culminated into one even larger public health crisis. The pandemic forced people to stay local and opt for close-by areas to take a swim. Because of this, as well as the reduced risk of contracting COVID-19 outdoors, people flocked in unusually high numbers to ocean beaches and freshwater recreation sites to stay active and cool. Unfortunately, if outdoor crowds become too big and dense, there is an increased risk of COVID-19 spread. The fact that so many people sought respite outside made clear the importance of open space for physical and mental health. But, the benefits of open space are not equally experienced by all. Black and Latinx communities have been systemically denied access to parks and nature, and there is a lot of work to do to provide justice for these communities. LA City and County must work hard to meet their target of 65% of Angelenos living within half a mile of a park or open space by 2025 (and 75% by 2035).

Photo by Alice Dison
The summer’s extreme heat waves coincided with the largest wildfires in California’s history, which created harmful air quality across the entire west coast. Many people endured hazardous outdoor air quality in order to cool off at rivers, streams, and beaches. Tragically, exposure to wildfire-induced poor air quality exacerbates the harmful health effects of COVID-19. So for low-income households without air conditioning, it was impossible to escape harm; people were either subject to extreme heat at home or subject to harmful air quality outside. We must acknowledge that in the United States, the communities facing the brunt of climate change impacts like extreme heat and wildfire are disproportionately Indigenous, Black, Hispanic, and Asian people.
Summer 2020 was a tough time for many, and it underscores the need for immediate and equitable action to address the climate crisis and environmental justice.
Looking forward, Heal the Bay will continue to advocate for water quality improvements across LA County, so everyone is protected from waterborne illness. And, we will continue to push for nature-based policies that stem the impacts of climate change and make our communities climate resilient.
Summer 2020 Results
Here are the water quality results from the sites Heal the Bay monitored during summer 2020.
Malibu Creek State Park
Rock Pool – did slightly better than last year
- 64% Green
- 35% Yellow
- 0% Red
Las Virgenes Creek – worse than last year
- 0% Green
- 93% Yellow
- 7% Red
Los Angeles River
Sepulveda Basin at Burbank Ave. – slightly better than last year
- 31% Green
- 69% Yellow
- 0% Red
Rattlesnake Park – worse than last year
- 15% Green
- 33% Yellow
- 51% Red
Steelhead Park – same as last year
- 64% Green
- 33% Yellow
- 3% Red
Learn More: