
Top

Heal the Bay Blog

Author: Heal the Bay

Aug. 15, 2016 — Longtime board member takes reins from Alix Hobbs, who is departing for new job running the Crystal Cove Alliance in Orange County.

Heal the Bay’s board of directors has announced that Stephanie Medina will serve as interim president and CEO following the recent departure of  Alix Hobbs as chief of the environmental nonprofit.

Medina, a longtime board member and past chairman, will assume responsibility for financial, operational and strategic oversight of the organization.

She will share management duties with vice president Sarah Sikich, who oversees science and policy initiatives. In the coming months, the board will pursue a leadership search that includes both internal and external candidates.

The move follows the board of directors’ adoption of comprehensive 10-year strategic plan spearheaded by Hobbs, as well as a highly successful fundraising campaign to solidify the group’s financial foundation amid a slowly recovering regional economy.

Hobbs, a nearly 20-veteran of the Santa Monica-based nonprofit, has accepted a job as president of the Crystal Cove Alliance in Newport Beach. She will remain connected to Heal the Bay, and has accepted a voting position on our board of directors.

“The Heal the Bay family is exactly that — a family of devoted, passionate, capable and smart people,” said Hobbs. “So stepping away after all these years is emotional. But I depart knowing that we have left the next generation with something much better than what we inherited.”

A San Fernando Valley resident, Medina has held several management positions in the nonprofit and media sectors. She most recently served as a senior vice president of community relations for the Special Olympics’ World Games 2015, following positions directing Public Affairs at broadcast stations KTLA and KCAL/KCBS. She also served on the city of Los Angeles’ Transportation Commission.

“Having served on the board for so many years, I got to see the good work that our staff and volunteers do,” said Medina. “But now I get to come into our office every day! I couldn’t be more honored to lead the team in our next phase of growth.”

As part of its new strategic plan, the staff and board of Heal the Bay is focusing on three key directional goals in the coming decade:

  • To better protect public health, we will work to ensure that people can swim and fish at every beach in L.A. County without risk of getting sick.
  • To ensure a more sustainable water future, we will work to ensure that L.A. County sources 60% of its water locally through conservation and reuse by 2025.
  • To restore the vibrancy of our local oceans and watersheds, we will work to ensure that all greater L.A. coastal and river habitats are healthy.


For 2017 grades, please see our River Report Card.

Heal the Bay’s inaugural study of Los Angeles River microbial water quality that we published July 27, 2016 and last year’s study on swimming holes in the Santa Monica Mountains called for more readily available public water quality information. The public has a right to know about water quality conditions in these freshwater recreation areas so that they can make informed decisions on how to minimize the risk of getting sick.

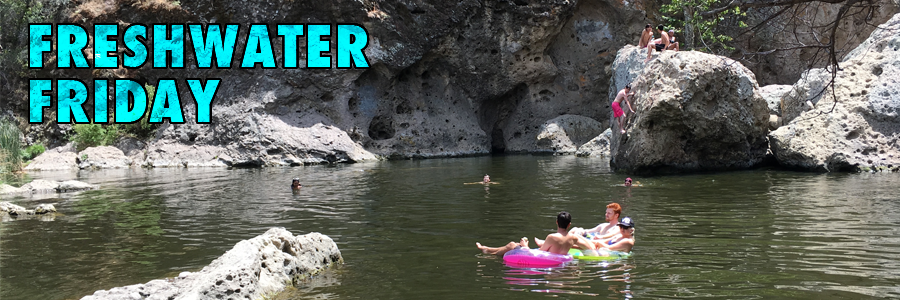
We will be posting an update every Friday during the summer with water quality information from our weekly sampling of freshwater recreation sites in Los Angeles County.

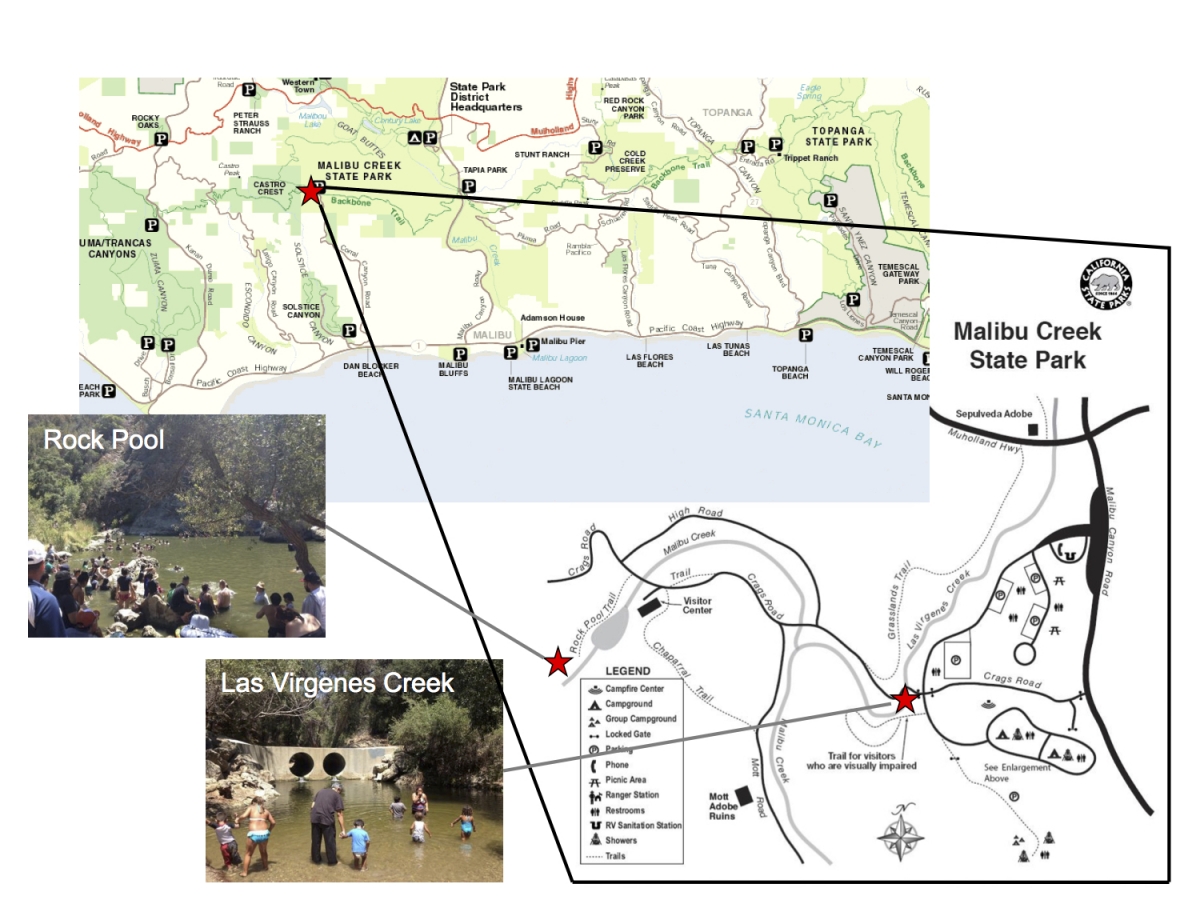
Malibu Creek State Park – Number of Exceedances
Site Name 9/29/16 9/21/16 9/15/16 9/7/16 8/31/16 8/24/16 8/17/16 8/10/16 8/3/16
Rock Pool 0 out of 4

None of the four criteria exceed the threshold values this week at Rock Pool site in Malibu Creek. The single sample E. coli value was below the threshold of 235 MPN/100ml, and the geometric mean for E. coli was below 126 MPN/100ml. The single sample Enterococcus value was also below the threshold of 110 MPN/100ml as was the geometric mean value for Enterococcus (below 30 MPN/100ml). Since June 15, 2016, we have documented exceedance rates (for single samples) of 20% for E. coli and 13% for Enterococcus at this site.
0 out of 4

None of the four criteria exceed the threshold values this week at Rock Pool site in Malibu Creek. The single sample E. coli value was below the threshold of 235 MPN/100ml, and the geometric mean for E. coli was below 126 MPN/100ml. The single sample Enterococcus value was also below the threshold of 110 MPN/100ml as was the geometric mean value for Enterococcus (below 30 MPN/100ml). Since June 15, 2016, we have documented exceedance rates (for single samples) of 21% for E. coli and 14% for Enterococcus at this site.
0 out of 4

None of the four criteria exceed the threshold values this week at Rock Pool site in Malibu Creek. The single sample E. coli value was below the threshold of 235 MPN/100ml, and the geometric mean for E. coli was below 126 MPN/100ml. The single sample Enterococcus value was also below the threshold of 110 MPN/100ml as was the geometric mean value for Enterococcus (below 30 MPN/100ml). Since June 15, 2016, we have documented exceedance rates (for single samples) of 23% for E. coli and 15% for Enterococcus at this site.
1 out of 4

Only one of the four criteria exceeds the threshold values this week at Rock Pool site in Malibu Creek. The single sample E. coli value was below the threshold of 235 MPN/100ml, and the geometric mean for E. coli was below 126 MPN/100ml. The single sample Enterococcus value was also below the threshold of 110 MPN/100ml but the geometric mean value for Enterococcus was over the threshold of 30 MPN/100ml. Since June 15, 2016, we have documented exceedance rates (for single samples) of 25% for E. coli and 17% for Enterococcus at this site.
1 out of 4

Only one of the four criteria exceeds the threshold values this week at Rock Pool site in Malibu Creek. The single sample E. coli value was below the threshold of 235 MPN/100ml, and the geometric mean for E. coli was below 126 MPN/100ml. The single sample Enterococcus value was also below the threshold of 110 MPN/100ml but the geometric mean value for Enterococcus was over the threshold of 30 MPN/100ml. Since June 15, 2016, we have documented exceedance rates (for single samples) of 27% for E. coli and 18% for Enterococcus at this site.
2 out of 4

Two of the four criteria exceed the threshold values this week at Rock Pool site in Malibu Creek. The single sample E. coli value was below the threshold of 235 MPN/100ml, and the geometric mean for E. coli was below 126 MPN/100ml. In contrast, both the single sample and geometric mean values for Enterococcus were over their respective thresholds. Since June 15, 2016, we have documented exceedance rates (for single samples) of 30% for E. coli and 20% for Enterococcus at this site.
1 out of 4

One of the four criteria exceeds the threshold values this week at Rock Pool site in Malibu Creek. For both E. coli and Enterococcus, the single sample values were under their respective thresholds. The geometric mean value for E. coli was under its threshold, while Enterococcus was over its threshold. Since June 15, 2016, we have documented exceedance rates (for single samples) of 33% for E. coli and 11% for Enterococcus at this site.
2 out of 4

Two of the four criteria exceed the threshold values this week at Rock Pool site in Malibu Creek. For both E. coli and Enterococcus, the single sample values were under their respective thresholds but the geometric mean values were over the thresholds. Since June 15, 2016, we have documented exceedance rates (for single samples) of 33% for E. coli and 12% for Enterococcus at this site.
3 out of 4

Three of the four criteria exceed the threshold values this week at Rock Pool site in Malibu Creek. For E. coli, the single sample and geometric mean values were over threshold values; the single sample Enterococcus value was under the threshold of 110 MPN/100ml but the geometric mean value was over the threshold value. Since June 15, 2016, we have documented exceedance rates (for single samples) of 43% for E. coli and 14% for Enterococcus at this site.
Las Virgenes Creek at the Bridge 1 out of 4

Only one of the four criteria exceed the threshold values this week at Las Virgenes Creek at the bridge. The single sample E. coli value was below the threshold of 235 MPN/100ml, and the geometric mean for E. coli was below 126 MPN/100ml. The single sample Enterococcus value was also below the threshold of 110 MPN/100ml but the geometric mean value for Enterococcus was over the threshold of 30 MPN/100ml. Since June 15, 2016, we have documented exceedance rates (for single samples) of 27% for E. coli and 53% for Enterococcus at this site.
3 out of 4

Three of the four criteria exceed the threshold values this week at Las Virgenes Creek at the bridge. The single sample E. coli value was below the threshold of 235 MPN/100ml but the geometric mean value for E. coli was over the threshold of 126 MPN/100ml.The single sample Enterococcus value was over the threshold of 110 MPN/100ml and the geometric mean value for Enterococcus was over the threshold of 30 MPN/100ml. Since June 15, 2016, we have documented exceedance rates (for single samples) of 29% for E. coli and 57% for Enterococcus at this site.
2 out of 4

Two of the four criteria exceed the threshold values this week at Las Virgenes Creek at the bridge. The single sample E. coli value was below the threshold of 235 MPN/100ml but the geometric mean value for E. coli was over the threshold of 126 MPN/100ml.The single sample Enterococcus value was below the threshold of 110 MPN/100ml but the geometric mean value for Enterococcus was over the threshold of 30 MPN/100ml. Since June 15, 2016, we have documented exceedance rates (for single samples) of 31% for E. coli and 54% for Enterococcus at this site.
2 out of 4

Two of the four criteria exceed the threshold values this week at Las Virgenes Creek at the bridge. The single sample E. coli value was below the threshold of 235 MPN/100ml but the geometric mean value for E. coli was over the threshold of 126 MPN/100ml.The single sample Enterococcus value was below the threshold of 110 MPN/100ml but the geometric mean value for Enterococcus was over the threshold of 30 MPN/100ml. Since June 15, 2016, we have documented exceedance rates (for single samples) of 33% for E. coli and 58% for Enterococcus at this site.
3 out of 4

Three of the four criteria exceed the threshold values this week at Las Virgenes Creek at the bridge. The single sample and geometric mean values for E. coli value were both over their respective thresholds of 235 MPN/100ml and 126 MPN/100ml. The single sample Enterococcus value was below the threshold of 110 MPN/100ml but the geometric mean value for Enterococcus was over the threshold of 30 MPN/100ml. Since June 15, 2016, we have documented exceedance rates (for single samples) of 36% for E. coli and 64% for Enterococcus at this site.
3 out of 4

Three of the four criteria exceed the threshold values this week at Las Virgenes Creek at the bridge. The single sample E. coli value was below the threshold of 235 MPN/100ml, while the geometric mean for E. coli was over 126 MPN/100ml. Both the single sample and geometric mean values for Enterococcus were over their respective thresholds. Since June 15, 2016, we have documented exceedance rates (for single samples) of 30% for E. coli and 70% for Enterococcus at this site.
4 out of 4

Four of the four criteria exceed the threshold values this week at Las Virgenes Creek at the bridge. The single sample E. coli value was above the threshold of 235 MPN/100ml, and the geometric mean for E. coli was over 126 MPN/100ml. Similarly, both the single sample and geometric mean values for Enterococcus were over their respective thresholds. Since June 15, 2016, we have documented exceedance rates (for single samples) of 33% for E. coli and 67% for Enterococcus at this site.
3 out of 4

Three of the four criteria exceed the threshold values this week at Las Virgenes Creek at the bridge. The single sample E. coli value was below the threshold of 235 MPN/100ml but the geometric mean for E. coli was over 126 MPN/100ml, and both the single sample and geometric mean values for Enterococcus were over their respective thresholds. Since June 15, 2016, we have documented exceedance rates (for single samples) of 25% for E. coli and 62% for Enterococcus at this site.
3 out of 4

Three of the four criteria exceed the threshold values this week at Las Virgenes Creek at the bridge. The single sample E. coli value was below the threshold of 235 MPN/100ml but the geometric mean for E. coli was over 126 MPN/100ml, and both the single sample and geometric mean values for Enterococcus were over their respective thresholds. Since June 15, 2016, we have documented exceedance rates (for single samples) of 29% for E. coli and 57% for Enterococcus at this site.
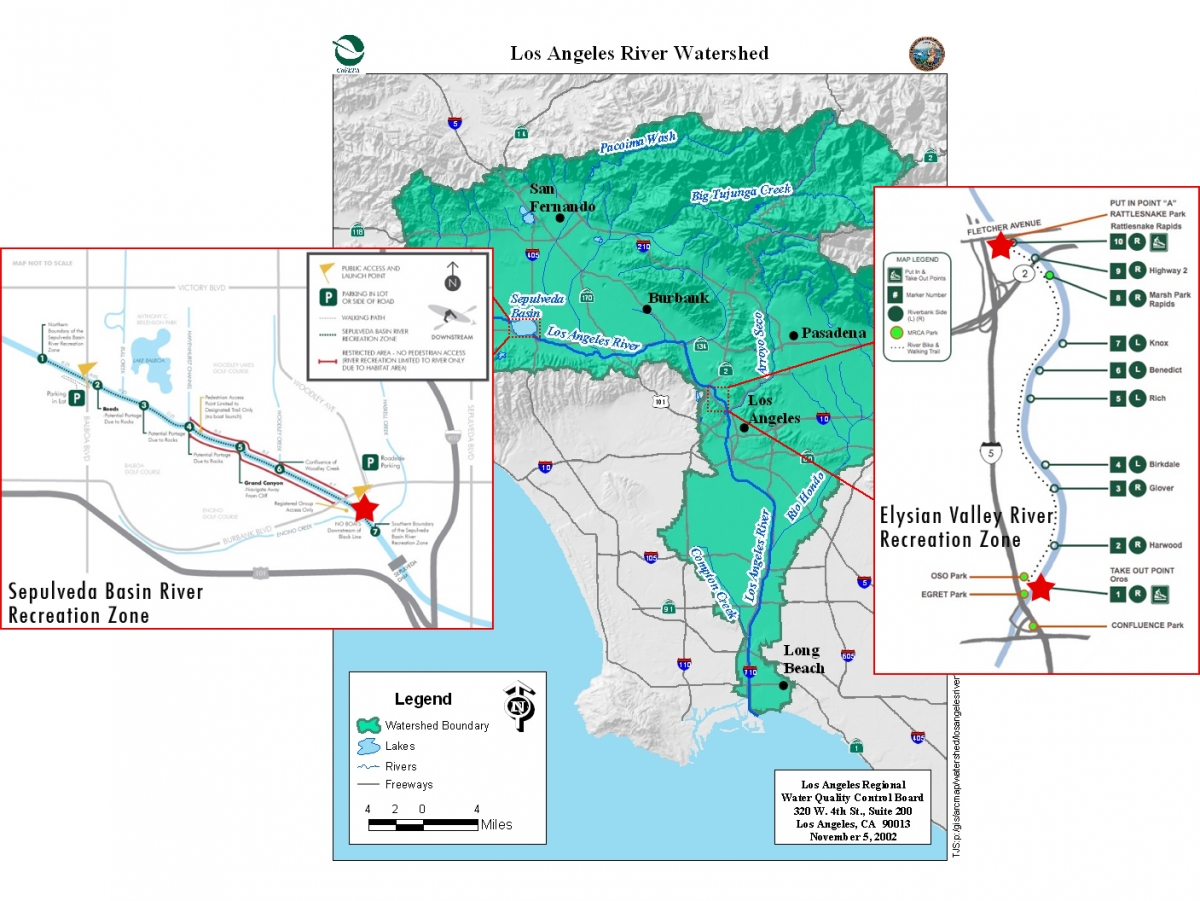
Los Angeles River – Number of Exceedances
Site Name 9/27/16 9/20/16 9/13/16 9/6/16 8/30/16 8/23/16
Steelhead Park, Elysian Valley 1 out of 4

Only one of the four criteria exceeds the threshold values this week at the Steelhead Park site for the Los Angeles River. The single sample E. coli value was below the threshold of 235 MPN/100ml, and the geometric mean for E. coli was below 126 MPN/100ml. The single sample Enterococcus value was also below the threshold of 110 MPN/100ml but the geometric mean value for Enterococcus was over the threshold of 30 MPN/100ml. Since May 31, 2016, we have documented exceedance rates (for single samples) of 6% for E. coli and 61% for Enterococcus at this site.
1 out of 4

Only one of the four criteria exceeds the threshold values this week at the Steelhead Park site for the Los Angeles River. The single sample E. coli value was below the threshold of 235 MPN/100ml, and the geometric mean for E. coli was below 126 MPN/100ml. The single sample Enterococcus value was also below the threshold of 110 MPN/100ml but the geometric mean value for Enterococcus was over the threshold of 30 MPN/100ml. Since May 31, 2016, we have documented exceedance rates (for single samples) of 6% for E. coli and 65% for Enterococcus at this site.
1 out of 4

Only one of the four criteria exceeds the threshold values this week at the Steelhead Park site for the Los Angeles River. The single sample E. coli value was below the threshold of 235 MPN/100ml, and the geometric mean for E. coli was below 126 MPN/100ml. The single sample Enterococcus value was also below the threshold of 110 MPN/100ml but the geometric mean value for Enterococcus was over the threshold of 30 MPN/100ml. Since May 31, 2016, we have documented exceedance rates (for single samples) of 6% for E. coli and 69% for Enterococcus at this site.
1 out of 4

Only one of the four criteria exceeds the threshold values this week at the Steelhead Park site for the Los Angeles River. The single sample E. coli value was below the threshold of 235 MPN/100ml, and the geometric mean for E. coli was below 126 MPN/100ml. The single sample Enterococcus value was also below the threshold of 110 MPN/100ml but the geometric mean value for Enterococcus was over the threshold of 30 MPN/100ml. Since May 31, 2016, we have documented exceedance rates (for single samples) of 7% for E. coli and 73% for Enterococcus at this site.
2 out of 4

Two of the four criteria exceed the threshold values this week at the Steelhead Park site for the Los Angeles River. The single sample E. coli value was below the threshold of 235 MPN/100ml, and the geometric mean for E. coli was below 126 MPN/100ml. In contrast, both the single sample and geometric mean values for Enterococcus were over their respective thresholds (110 and 30 MPN/100ml). Since May 31, 2016, we have documented exceedance rates (for single samples) of 7% for E. coli and 79% for Enterococcus at this site.
2 out of 4

Two of the four criteria exceed the threshold values this week at the Steelhead Park site for the Los Angeles River. The single sample E. coli value was below the threshold of 235 MPN/100ml, and the geometric mean for E. coli was below 126 MPN/100ml. In contrast, both the single sample and geometric mean values for Enterococcus were over their respective thresholds. Since May 31, 2016, we have documented exceedance rates (for single samples) of 8% for E. coli and 77% for Enterococcus at this site.
Rattlesnake Park, Elysian Valley 3 out of 4

Three of the four criteria exceed the threshold values this week at the Rattlesnake Park site for the Los Angeles River. The single sample value for E. coli was below the threshold of 235 MPN/100ml, but the geometric mean for E. coli was over the threshold of 126 MPN/100ml. Both the single sample and geometric mean values for Enterococcus were also over their respective thresholds (110 and 30 MPN/100ml). Since May 31, 2016, we have documented exceedance rates (for single samples) of 50% for E. coli and 100% for Enterococcus at this site.
4 out of 4

All four of the criteria exceed the threshold values this week at the Rattlesnake Park site for the Los Angeles River. The single sample and geometric mean values for E. coli value were above the thresholds of 235 and 126 MPN/100ml, respectively. Both the single sample and geometric mean values for Enterococcus were also over their respective thresholds (110 and 30 MPN/100ml). Since May 31, 2016, we have documented exceedance rates (for single samples) of 53% for E. coli and 100% for Enterococcus at this site.
4 out of 4

All four of the criteria exceed the threshold values this week at the Rattlesnake Park site for the Los Angeles River. The single sample and geometric mean values for E. coli value were above the thresholds of 235 and 126 MPN/100ml, respectively. Both the single sample and geometric mean values for Enterococcus were also over their respective thresholds (110 and 30 MPN/100ml). Since May 31, 2016, we have documented exceedance rates (for single samples) of 50% for E. coli and 100% for Enterococcus at this site.
3 out of 4

Three of the four criteria exceed the threshold values this week at the Rattlesnake Park site for the Los Angeles River. The single sample E. coli value was below the threshold of 235 MPN/100ml, but the geometric mean for E. coli was over 126 MPN/100ml. Both the single sample and geometric mean values for Enterococcus were over their respective thresholds (110 and 30 MPN/100ml). Since May 31, 2016, we have documented exceedance rates (for single samples) of 47% for E. coli and 100% for Enterococcus at this site.
3 out of 4

Three of the four criteria exceed the threshold values this week at the Rattlesnake Park site for the Los Angeles River. The single sample E. coli value was below the threshold of 235 MPN/100ml, but the geometric mean for E. coli was over 126 MPN/100ml. Both the single sample and geometric mean values for Enterococcus were over their respective thresholds (110 and 30 MPN/100ml). Since May 31, 2016, we have documented exceedance rates (for single samples) of 50% for E. coli and 100% for Enterococcus at this site.
4 out of 4

Four of the four criteria exceed the threshold values this week at the Rattlesnake Park site for the Los Angeles River. The single sample E. coli value was above the threshold of 235 MPN/100ml, and the geometric mean for E. coli was over 126 MPN/100ml. Similarly, both the single sample and geometric mean values for Enterococcus were over their respective thresholds. Since May 31, 2016, we have documented exceedance rates (for single samples) of 54% for E. coli and 100% for Enterococcus at this site.
Sepulveda Basin at Burbank Blvd. 1 out of 4

Only one of the four criteria exceeds the threshold values this week at the Sepulveda Basin site for the Los Angeles River. The single sample E. coli value was below the threshold of 235 MPN/100ml, and the geometric mean for E. coli was below 126 MPN/100ml. The single sample Enterococcus value was also below the threshold of 110 MPN/100ml but the geometric mean value for Enterococcus was over the threshold of 30 MPN/100ml. Since May 31, 2016, we have documented exceedance rates (for single samples) of 0% for E. coli and 6% for Enterococcus at this site.
1 out of 4

Only one of the four criteria exceeds the threshold values this week at the Sepulveda Basin site for the Los Angeles River. The single sample E. coli value was below the threshold of 235 MPN/100ml, and the geometric mean for E. coli was below 126 MPN/100ml. The single sample Enterococcus value was also below the threshold of 110 MPN/100ml but the geometric mean value for Enterococcus was over the threshold of 30 MPN/100ml. Since May 31, 2016, we have documented exceedance rates (for single samples) of 0% for E. coli and 6% for Enterococcus at this site.
1 out of 4

Only one of the four criteria exceeds the threshold values this week at the Sepulveda Basin site for the Los Angeles River. The single sample E. coli value was below the threshold of 235 MPN/100ml, and the geometric mean for E. coli was below 126 MPN/100ml. The single sample Enterococcus value was also below the threshold of 110 MPN/100ml but the geometric mean value for Enterococcus was over the threshold of 30 MPN/100ml. Since May 31, 2016, we have documented exceedance rates (for single samples) of 0% for E. coli and 6% for Enterococcus at this site.
1 out of 4

Only one of the four criteria exceeds the threshold values this week at the Sepulveda Basin site for the Los Angeles River. The single sample E. coli value was below the threshold of 235 MPN/100ml, and the geometric mean for E. coli was below 126 MPN/100ml. The single sample Enterococcus value was also below the threshold of 110 MPN/100ml but the geometric mean value for Enterococcus was over the threshold of 30 MPN/100ml. Since May 31, 2016, we have documented exceedance rates (for single samples) of 0% for E. coli and 7% for Enterococcus at this site.
1 out of 4

Only one of the four criteria exceeds the threshold values this week at the Sepulveda Basin site for the Los Angeles River. The single sample E. coli value was below the threshold of 235 MPN/100ml, and the geometric mean for E. coli was below 126 MPN/100ml. The single sample Enterococcus value was also below the threshold of 110 MPN/100ml but the geometric mean value for Enterococcus was over the threshold of 30 MPN/100ml. Since May 31, 2016, we have documented exceedance rates (for single samples) of 0% for E. coli and 7% for Enterococcus at this site.
2 out of 4

Two of the four criteria exceed the threshold values this week at the Sepulveda Basin site for the Los Angeles River. The single sample E. coli value was below the threshold of 235 MPN/100ml, and the geometric mean for E. coli was below 126 MPN/100ml. In contrast, both the single sample and geometric mean values for Enterococcus were over their respective thresholds. Since May 31, 2016, we have documented exceedance rates (for single samples) of 0% for E. coli and 8% for Enterococcus at this site.

We envision safe swimmable rivers and creeks throughout Los Angeles County. However, a number of recreational waterbodies are not regularly monitored or monitored at all. We know thousands of Angelenos use these aquatic resources.

As such, Heal the Bay would rather provide some information about the water quality they are immersing themselves into rather than no information. The idea is to prompt the user to ask questions about these waterbodies: What is the origin of the water? Can I get sick from it? What types of illnesses can I get? How do I get more information? Check out the answers to these questions and more in our FAQ and the joint statement on recreation in the L.A. River.

Malibu Creek State Park testing sites mapL.A. River testing sites map

Heal the Bay has been monitoring water quality in streams and rivers since 1998 through our Stream Team program. In 2014 we initiated a pilot study to monitor human use and water quality at freshwater swimming spots in the Santa Monica Mountains, focusing on bacterial pollution and public health implications. We are currently in our third summer of monitoring water quality in those swimming locations. Given Heal the Bay’s 25-year history of informing and educating beachgoers about beach water quality through our Beach Report Card, assessing the water quality of the Los Angeles River recreation zones was a natural next step. We are now in our second season of monitoring for the L.A. River recreation zones.

The A-to-F grading system of the Beach Report Card took years of work to develop and fine-tune. We are only in the very early stages of thinking about an analogous River Report Card. But we want to start by making basic water quality information available to the public in a timely manner.

We will be providing weekly information about levels of fecal indicator bacteria at five sites. We will report on whether the sample from the current week exceeded limits set by the Regional Water Quality Control Board and US EPA and what the microbial water quality has been over the summer sampling season thus far.

We will report on two types of fecal indicator bacteria, or FIB: E. coli and Enterococcus. FIB, while not harmful themselves, indicate the possible presence of pathogenic bacteria, which have been found to cause ear infections, skin rashes, respiratory illnesses and gastrointestinal illness. High levels of FIB are particularly concerning in areas where people come in contact with water through activities like swimming, fishing, and kayaking.

Excuse us for getting technical in this next section, but we just want to be clear about what we are measuring and what constitutes an exceedance.

We compare bacteria levels measured at each site to water quality objectives from the Total Maximum Daily Loads (TMDL) for Bacteria in the Malibu Creek Watershed and the Los Angeles River Watershed as well as EPA’s 2012 Recreational Water Quality Criteria (RWQC)

The freshwater regulatory limit for E. coli is set in the TMDL at 235 MPN/100ml for a single sample and 126 MPN/100ml for the geometric mean. (A geometric mean is a type of average that results in a number that is not as heavily affected by very high or very low values).

We calculate geometric means from all samples over the last 30-day period (usually four or five samples). For Enterococcus, we used EPA’s statistical threshold value for an illness rate of 32/1,000 (the more protective rate), which is 110 MPN/100ml for a single sample and 30 MPN/100ml for the geometric mean in a fresh waterbody designated for recreation.

For each site, we will report on the number of criteria that exceeded four standards. A site can have 0-4 out of four exceedances. A sample exceeds if:

  • E. coli single sample > 235 MPN/100ml
  • E. coli geometric mean > 126 MPN/100ml
  • Enterococcus single sample is > 110 MPN/100ml
  • Enterococcus geometric mean is > 30 MPN/100ml

So, what does that all mean?

The greater the number and magnitude of exceedances at a site, the worse the water quality is, indicating a potentially increased risk of getting sick.

Deciding what to do with this information depends on the risk level you are comfortable with. Single sample values give you an indication of the most recent water quality, while geometric mean values give you an indication of the ambient water quality over the last 30 days.

However, it is important to note that the single sample gives information for the day on which the sample was taken and conditions can change throughout the week until the next sample is taken.

The thresholds that the US EPA and the RWQCB have put forth are based on epidemiological studies and risk. An increased risk of illness is not a guarantee that you will get sick. Certain activities are more risky when water quality is poor; for instance, swimming and submerging your head is more risky than wading; swimming is more risky than kayaking; kayaking is likely more risky than hiking (at least with regards to picking up a waterborne illness), and so on, with the risk dependent on how likely you are to ingest or contact water.

We recommend following these best practices to stay safe and healthy.

  • Swimming: In waters known to exceed bacterial limits, swimming is not recommended, particularly submerging one’s head. Elevated bacteria levels can occur at any time. Swimmers should use caution when entering the water by checking the latest water quality results, avoiding contact immediately after a rainfall, if they are immunocompromised, or if they have an open wound. If there is any water contact, then rise off with soap and water afterward.
  • Kayaking and Fishing: In waters that are known to exceed bacterial limits, people should limit water contact, especially avoiding hand-to-face water contact. Users should not enter the water with an open wound, if immunocompromised, or after a rainfall. If there is any water contact, then rinse off with soap and water afterward.


Become a Heal the Bay Community Advocate and inspire others to make a difference!

Attend our Community Advocates Training to learn how to communicate our work, educate others about the impacts of ocean pollution, and represent Heal the Bay at various outreach events, such as the KROQ Weenie Roast, Santa Monica Festival, and many more!
This is a great opportunity for those who wish to speak directly to the public about the issues that affect our local waters and watersheds.
Plus who doesn’t want some cool Heal the Bay swag? Earn your Heal the Bay t-shirt today!

Wednesday, August 10th, 2016

  • Heal the Bay Main Office (snacks provided)
  • 6:00P.M. – 8:00 P.M.

To RSVP, click here.

To learn more about Community Advocates, please click here.

We’ll have plenty of outreach events coming up during Earth Month (April), so sign up today!

Required: Attendance to a Heal the Bay Volunteer Orientation. Check the calendar for upcoming orientations.


Join Heal the Bay’s prestigious Speakers Bureau!

For over 25 years Speakers Bureau has been an integral part of Heal the Bay’s mission. Speaker Bureau volunteers spread educational awareness to schools, organizations and businesses about the causes and consequences of ocean pollution, water issues, and what everyone can do to help. Just last year we were able to reach out to over 30,000 LA County residents!

Classroom Training Session Dates:
Tuesday, August 9th, 1:00pm – 4:30pm
Tuesday, August 16th, 12:00pm – 4:30pm (includes a tour of the Environmental Learning Center from 12 – 1pm!)
Tuesday, August 23rd, 1:00pm – 4:30pm

Location:
Environmental Learning Center at the Hyperion Treatment Plant
12000 Vista Del Mar, Los Angeles, CA 90293

Field Training Session Dates:
Saturday, August 20th, 10:00am – 12:00pm
Redondo Beach Pier South (Tower Ruby)
Redondo Beach, CA 90277

Attendance at all sessions is mandatory – we cover a lot of important information. Make the commitment to protect what you love! Come learn how to make a difference for your community and inspire others – no matter where you live, you can make an impact! Learn more about the program.

REGISTER HERE

You can make a suggested donation of $25 to cover your training costs when you register! We hope to see you there!


July 20, 2016 — UPDATE: L.A. Sanitation estimates that 2,853,200 gallons of sewage was released from the broken sewer during Monday’s spill. Of this amount, 829,100 gallons were contained and returned to the sewer system, while 1,754,100 gallons ultimately reached the Los Angeles River. Emergency sewer repair crews are constructing a permanent bypass system to divert sewage flow around the portion of the pipe that collapsed.

We are still awaiting more complete water quality data from Long Beach and Seal Beach.

July 19, 2016 — BREAKING NEWS: Yesterday afternoon around 2 p.m., a large sewage pipe ruptured near Boyle Heights, spilling 2.4 million gallons of sewage into the L.A. River. The river empties out in Long Beach, so, as a precautionary measure, all beaches in the city of Long Beach are currently closed until further notice. Beaches in Seal Beach from the mouth of the San Gabriel River to Anaheim Bay are also closed.

It’s too early to pinpoint the exact cause of the spill, but aging water and sewage infrastructure is likely to blame: The pipe that collapsed was built in 1929.

While no sewage has been seen on the beach yet, ocean water samples are currently being tested for bacteria that could make swimmers sick. Results should be available on Wednesday, and beaches could reopen as early as Thursday.

Heal the Bay water quality scientists are in touch with public health officials and will keep this blog updated as the situation develops.

For the latest updates, follow us on Twitter at @healthebay and @beachreportcard.

Long Beach closed due to sewage spill (Image by Gary Coronado / Los Angeles Times)

Sources: Los Angeles Times, Patch.com


July 14, 2016 — This past spring Heal the Bay hosted our first-ever BioBlitzes at two of Los Angeles’ remaining wetlands: Malibu Lagoon and Ballona Wetlands. BioBlitzes bring people together to rapidly (over a period of a few hours) catalogue and identify plant and animal life in biodiverse areas. Wetlands are unique and critical ecosystems that are in trouble – in the last couple hundred years, Southern California has lost over 90% of its native wetlands.

Wetlands provide many services, which often go by unappreciated. They help regulate climate, store surface water, control pollution and flooding, replenish natural aquifers, protect shorelines, maintain natural communities of plants and animals, and provide opportunities for education and recreation. (For more information about Southern California’s wetlands, check out http://scwrp.org/general-wetlands-information/). Unfortunately, years of development and degradation have destroyed the flow of water, altering the habitat for wetland animals and plants. Heal the Bay supported the restoration of Malibu Lagoon from 2012 to 2013 and now we’re lobbying for the restoration of Ballona Wetlands as well to bring it back to a healthy, functional state. Our BioBlitz events helped capture and illuminate the amazing biodiversity of these areas. After crunching the numbers from these events, it seems timely to share our findings leading up to this Saturday’s beach cleanup and sneak peek at the Ballona reserve.

Malibu Lagoon species diversity pie chartMost of our observations were of the amazing plants that rely on the wetlands to thrive. Plants form this environment’s base, providing a natural filter for water as it passes through. They also provide habitat, food, and shelter for the populations of birds, insects, and reptiles that live in wetlands. We found both sites were host to dozens of bird species including great blue herons, snowy egrets, and brown pelicans. Every year, almost one billion birds migrate along the coast of California in an area known as the Pacific coast flyway. Wetlands in Southern California are a crucial pit stop for migratory birds and the diversity of species we observed is promising. In just three hours at Ballona, we saw 17 different species of birds – almost a third of the bird species found in an extensive wetlands survey conducted by The Bay Foundation that spanned months. This shows the power of BioBlitzes to capture important data for conservation.

Malibu Lagoon species diversity bar graphFrom 2012 to 2013, Heal the Bay advocated for an ecological restoration of Malibu Lagoon which involved removing invasive species, replanting native ones, and adjusting the hydrology of the wetland. Inventories done by The Bay Foundation showed only six species of native plants prior to restoration, while almost 41 were noted after the restoration! Since plants form the base of an intricate web of life in the wetlands, bringing back natives can also bring back other species – including those that are threatened. At both sites our BioBlitzers found four threatened species, but that number will certainly increase with more sampling.

We found more than 20 introduced species at each site, which means they arrived through human influence. These invaders include everything from the delicate cabbage white butterfly to the crystalline ice plant. Invasive species are one of the biggest threats to healthy wetlands because they can outcompete native species and overtake the habitat. Since the restoration at Malibu Lagoon, the pervasiveness of non-natives has decreased. While Ballona is still struggling with invasive species, we hope planned restoration efforts will allow this wetland to reach its full potential.

Thanks to all of our “blitzers” for helping us Blitz the Bay in Ballona Wetlands and Malibu Lagoon. Keep exploring, enjoying, and fighting for our wetlands!

Citizen Science Coordinator Catherine Hoffman led these successful blitzing efforts.

California native legless lizard Brown Pelican by iNaturalist user @glmory A couple junior BioBlitzers looking for fauna in the creekbed


July 8, 2016 — Yesterday the Board of Supervisors voted to place the parks and open space funding measure on the ballot for this November – a crucial step in achieving our shared goals for access to clean, safe, water smart parks and open space across LA County! The measure will be a 1.5 cent per square foot tax levied annually – which means it will require a supermajority vote in November. $98 million dollars will be created by the tax, which will be managed by LA County’s Open Space District. There is a state measure moving through the legislature but local funding is key because it provides much needed maintenance money that the state bond will not.

Heal the Bay completed its 2015 strategic plan which included a new area of focus called Healthy Watersheds. To meet our new goal of connecting inland communities to their watersheds and to restore the vibrancy of our watersheds, Heal the Bay joined the #OurParks coalition with Trust for Public Land, Los Angeles Neighborhood Land Trust and The Nature Conservancy and many other groups to support the LA County Parks and Open Space measure. An unprecedented needs assessment illuminated $20 billion of needs across the county. The need for funding is urgent, since the last existing dedicated parks funding is set to expire in 2019.

Parks represent the vast majority of open space we have left in our dense, concrete laden watersheds. We have worked very closely with the Open Space District to ensure the grant programs within this funding measure will provide protection and opportunities for nature based solutions to our challenged water resources, including using parks to capture storm water, creating linear greenways along our rivers, and cool our cities – in addition to their traditional roles like creating safe places to play. This measure matched with future storm water funding will provide leverage for cities using parks to build projects to meet storm water quality mandates. The money can be used to:

  • Protect clean water resources, including rivers and creeks
  • Reduce gang activity and provide safe places to play
  • Ensure drinking water is safe at park and recreation centers
  • Remove asbestos, mold and lead paint from aging recreation centers
  • Protect and preserve parks and natural areas
  • Keep beaches open, clean and safe
  • Supports funding for high need areas

It was disappointing to hear the opposition from the Los Angeles Area Chamber of Commerce. When Gary Toebben, president, said “It’s pretty easy to have a cup of coffee when someone else is paying for it”, County Supervisor Sheila Kuehl replied, “You’ve had plenty of our cups of coffee.” She noted that commercial properties have received favorable treatment under Proposition 13, the property tax initiative approved by California voters in 1978.

What’s next? Click here to learn more about the campaign and final ballot language for the Safe Clean Neighborhood Parks, Open Space, Beaches, Rivers Protection and Water Conservation Measure.


July 8, 2016 — Last year, our supporters helped defeat a proposal to drill for oil underneath the Hermosa Beach seafloor. Now we face another ill-advised project in our Bay – a desalination plant on the El Segundo shoreline near the Manhattan Beach border.

In a time of persistent drought, we all agree on the need to reduce Southern California’s dependence on imported water. But a coaliton of environmental groups — including Heal the Bay, LA Waterkeeper and Surfrider — respectfully disagrees with West Basin Municipal Water District that building a costly and harmful ocean desalination plant is our best option.

Instead of literally sucking the life out of the Bay, West Basin can increase reliable local supplies by aggressively expanding reuse of water supplies we already have. By expanding reuse, we’ll seize on a once-in-a-lifetime opportunity to reliably meet our future water needs while reducing daily dumpings of tens-of-millions of gallons of wastewater in Santa Monica Bay. It’s a win-win.

Each day the Hyperion Water Reclamation Plant uselessly dumps 250 million gallons into the Bay. It’s time to value that highly treated water as the precious resource it is. We can no longer afford to throw water away. If Orange County can recycle 100 milion gallons each day, so can we.

To learn more about the proposed desal plant, and our preferred alternatives for securing water independence, please join our staff scientists and policy experts for a lively town-hall meeting in Manhattan Beach on July 21.

THE NEXT WAVE

A Special Town-Hall Meeting

Thursday, July, 21, 7:30 p.m.

Joslyn Community Center

1601 N. Valley Drive

Manhattan Beach


July 7, 2016 — Over the last ten months, citizen scientists of all ages helped our Santa Monica Pier Aquarium survey the humble Pacific Mole Crab (commonly known as the sand crab). More than 60 volunteers collected an immense amount of data about these sand crabs on the beach just outside the Aquarium’s doors – what did they learn?

Last year the Aquarium partnered with the Long-term Monitoring Program and Experiential Training for Students (LiMPETS). This statewide program activates people along the entire California coast to do real science through hands-on data collection – at the Santa Monica Pier we focused entirely on sand crabs, an indicator species useful for measuring the health of the entire ecosystem. We observed how rainfall, water temperature and tides affected the size, sex and abundance of sand crabs.

After consistently collecting data for almost a year we are beginning to see some trends. What is most exciting is the sheer number of sand crabs we’ve been seeing lately. In the winter, if we found two sand crabs we knew it was a good day. Now we’re consistently finding 15-25! What’s behind this drastic change?

Plotting average abundance of sand crabs over timeThe answer has to do with the sand crab’s life cycle. Adult sand crabs have a mating season between November and February. Their eggs develop for 30 days, before hatching into planktonic larvae. These larvae float around in the ocean for a little over four months and go through six different life stages (which ensures that they become widely dispersed and colonize new areas)! They eventually settle onto shore as juveniles, or “recruits,” and about a month later become fully grown adults. This explains why we are currently finding so many sand crabs, especially many of the recruits that were laid in the early months of mating season, drifted as plankton for months, and have now made the Santa Monica beach their home. As they continue to feed and grow, they will soon start the process all over again.

So if you joined on a sand crab survey trek in the winter, be sure to come back and help us find, count, and measure all of the sand crabs we have been finding on the Santa Monica beach!

Taylor Spesak, Public Programs AssistantTaylor Spesak is the Aquarium’s public programs educator. Join him every Wednesday at 3pm for sand crab monitoring. The program is included with Aquarium admission.


June 29, 2016 — Heal the Bay celebrates a concrete win in the decades-long fight to clean up polluted beaches in Malibu.

Malibu is one of the most breathtaking and desirable places to live in Southern California, but it has a dirty little secret – septic systems in and around its cultural center have fouled nearby coastal waters for decades.

Malibu Creek, Malibu Lagoon, and the surrounding ocean, including Surfrider Beach, are critically polluted and numerous studies point to septic systems as a major contributor. Swimmers who recreate in these waters run the risk of all kinds of illnesses.

But today Heal the Bay staff and members celebrated an important milestone in what has been a long and protracted fight to reduce water pollution in Malibu – groundbreaking on a Civic Wastewater Treatment Facility.

For more than 15 years, Heal the Bay has called for the Malibu Civic Center’s septic systems to be replaced by a centralized wastewater treatment facility. It has been a long and bumpy road, with officials complaining about costs and some residents worried about the specter of development if sewers are put in. But our advocacy is finally starting to yield tangible results.

The Los Angeles Regional Water Quality Control Board adopted a Septic Prohibition in 2009 that required the phasing out by 2019 of all septic systems in the Malibu Civic Center Area (think Malibu Pier, Pepperdine, Malibu Bluffs Park). And in 2015 the Malibu City Council unanimously certified the Civic Center Wastewater Treatment Facility Final Environmental Impact Report and later secured funding for the facility.

Malibu City Councilmembers, along with members of the California State and Regional Water Control Board, were all in attendance today to put golden shovel to dirt.

“The facility will enable Malibu to protect the natural environment that we cherish, while meeting state mandates to end the use of septic systems in the Civic Center area and producing recycled water to reduce Malibu’s reliance on potable water,” said Laura Rosenthal, Malibu’s current mayor.

Ground breaking at MalibuIt was especially gratifying to see Mark Gold, past Heal the Bay president and current board member, in attendance. Amid often fierce opposition from city officials and some Malibu property owners, Gold led the charge to demand an end to septic tanks in the Civic Center area for many years. He helped broker an MOU between the city and the regional water board that phased out septic tanks and mandated the building of a more modern treatment facility. (You can read more about his war wounds in one of his blog posts here.)

While today’s groundbreaking is a big step, the journey to better water quality is far from complete. Septic tanks are still in the process of being phased out and water quality in Malibu Creek, Malibu Lagoon, and local beaches isn’t likely to show improvement until the facility actually begins to treat local wastewater.

The wastewater treatment site is located at the intersection of Civic Center Way and Vista Pacifica. The facility will treat wastewater from properties in and around the Civic Center, and use the recycled water produced by the facility for irrigation of local parks and landscaping.

As the construction advances, we promise to remain vigilant and keep you updated.