After its second season predicting water quality in California, Heal the Bay’s NowCast program will hibernate until 2017. It’s a fitting moment for reflection by our fabulous beach water quality scientists, Ryan Searcy and Leslie Griffin.
Many would say that there are two distinct seasons in Southern California: summer and not-summer. By this way of thinking, it’s been hard to tell which season we’re currently in. We did see a bit of rain a few weeks ago, and it is certainly brisker in the mornings (hello fall sweaters!). Surf’s up in a way that whispers ever-so-slightly, “winter is coming.” But ocean water temperatures around here are still warm, and there is still plenty of sunshine, perhaps making the date-challenged among us wonder if Labor Day has indeed passed. You California dreamers out there can keep hanging on, but for those of us in the water quality business, the end of the AB411 season means it is officially not-summer.
State Assembly Bill (AB) 411 requires coastal agencies to sample water quality at popular beaches at least once per week from April 1 to October 31, and to notify the public of high concentrations of bacteria in those samples. Water quality samples measure the amount of fecal indicator bacteria (FIB) present in the water, organisms that are known to be associated with the presence of harmful human pathogens. If FIB levels are found to be above the prescribed state standards, that beach is required to be posted as hazardous to swimmer health.
Fortunately for us in Southern California, most of our beach agencies sample water quality year-round. But despite increased testing, these water quality samples have a serious draw-back: because bacterial culture methods (FIB tests) take 1-2 days to process, beachgoers never actually know if the water is safe on the day they visit the beach. This is a serious problem, and it is one that we’ve been trying to remedy for many years.
Historically, the Beach Report Card has only been able to report on how water quality has been at a beach according to the week’s bacteria sample data and the geometric mean of a handful of recent samples. It is still a great guide for beachgoers because it provides more information about beach water quality than any other system on the West Coast. But we wanted to make it even better, and that is why we have worked with Stanford University and UCLA to develop the California Water Quality NowCast system.
 Our NowCast system uses statistical models to provide daily water quality information during the AB411 season. These models predict the concentration of bacteria in the water every morning, and are derived from years of water quality data and a whole lot of environmental variables that impact bacteria levels. NowCasting helps us answer what we don’t readily know – how much bacteria is likely in the water each morning, and thus if it is safe to swim – by looking at what we do know – what was the weather like yesterday, were there a lot of waves this morning stirring up the water, is the nearby river a’ flowing, etc. All of this data crunching and statistical hog-wrestling boils allows us to predict whether beach bacterial concentrations are likely to be safe or hazardous each morning.
This was our second summer implementing the NowCast program. In 2015, we provided daily predictions for three beaches in Southern California: Arroyo Burro in Santa Barbara, Santa Monica Pier, and Doheny State Beach in Orange County. This year, we added East Beach in Santa Barbara and Belmont Pier in Long Beach to the program, and were able to make over 120 consecutive days of predictions for these five beaches. These predictions were available every morning by 10AM (including weekends) on our Beach Report Card site and mobile app. The beach agencies we worked with also took our results and posted them on their own sites and telephone hotlines.
And now that the Summer 2016 season is over, we are able evaluate our findings and to see how well our models did compared to the ‘current method’ of using days-old samples to make daily beach management decisions.
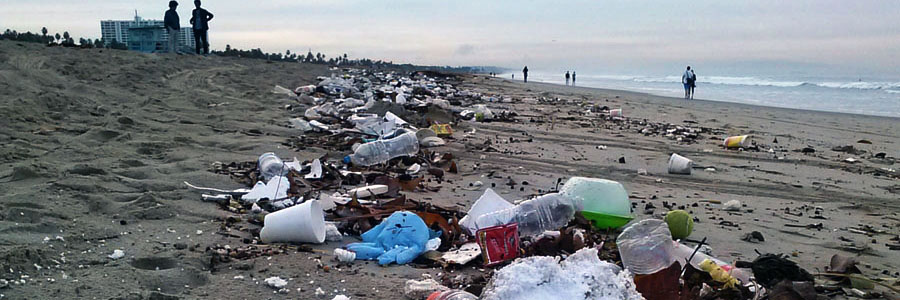
 The first major finding of the season was expected: the drought continues to positively impact beach water quality. Think about it like this: less rain means less runoff which means less bacteria in the waves. And as Californians continue to conserve water, there is less dry-weather runoff from outdoor watering (nice work, by the way!). Every beach in the NowCast program (except at the Santa Monica Pier) recorded water samples that came back under sample limits (the levels of bacteria below which it is reasonably safe to swim), much cleaner than those beaches’ historical trends! This is great news for California beachgoers – they were able to enjoy cleaner than average conditions this summer at the NowCast beaches, something that we were able to inform them of on a daily basis.
However, since beach conditions were so clean, it makes it difficult to see how we would have done at predicting dirty conditions. Except for Santa Monica Pier, there simply were no dirty samples available to do this. While this is a frustrating for those of us who want to look at the statistics, we can find solace in the fact that the models provided daily water quality predictions to the public (rather than weekly, like most sites).
 That being said, we did have one site with more issues than the rest: Santa Monica Pier. The Pier has a chronic history of water quality problems. From 2008-2015, it experienced 28% and 10% exceedance rates for fecal coliform and Enterococcus standards respectively (two types of FIB) in the summer months. This season, it exceeded those FIB standards 41% and 10% of the time respectively, despite drought conditions. This suggests that water quality at Santa Monica Pier is especially affected by other factors in addition to rainfall. Because our models consider wave action, wind speed and direction, and tides, the fecal coliform model for Santa Monica Pier was able to predict 71% of actual exceedances, and 17% more exceedances than using days-old samples in the months of July, August, and September. This was the big result that gives us confidence in our models.
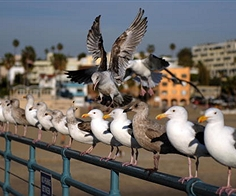
However, in October, the models did miss some exceedances at the Pier, highlighting why we reassess and refine our models every year as conditions change at our beaches, and why we try to incorporate new sources of data into the modeling process. For example, we learned that water quality at Santa Monica Pier is affected by nearby storm drain flows and seabird populations, both things that we currently don’t have a good way to get daily data on. In time, we hope to incorporate these factors into our models, creating more robust and accurate predictions.
 Looking forward, we’re excited for the California NowCast program to enter its third year. We’ve got a whole bunch of good stuff up next on the menu. For the Summer 2017 season, we are looking to add up to eight new beaches to the program. NowCasting will eventually expand farther along the California coastline, creating a truly statewide program. Winter models at beaches with heavy year-round use are also on our radar (in case you surfers out there were wondering). We’re designing new NowCast beach signage to post on days where water quality is predicted to be poor. And keep an eye out for our groovy new Beach Report Card website and mobile app, an update launching in 2017 that will look and function better than ever, giving beachgoers up to date water quality information on the fly.
When you go to the beach, we want you to catch waves, not a bug, and hopefully our NowCast program helped you do that this summer. Thank you to everyone who used and participated in the NowCast program in 2016, especially our beach agency partners across the state. Enjoy not-summer, and see you next year!


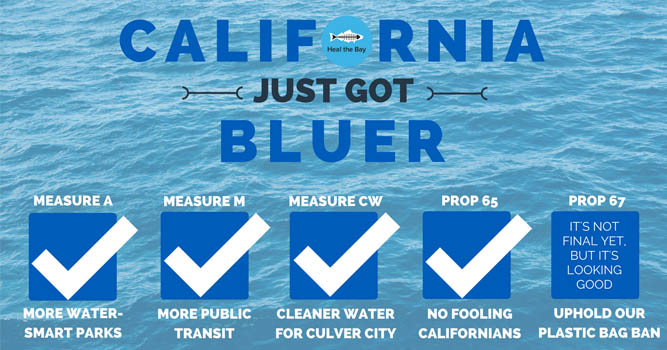
 Why are some grocery stores still offering plastic bags at the checkout?
  What does the law say about paper bags?
 How much can I be charged for a paper or reusable bag?
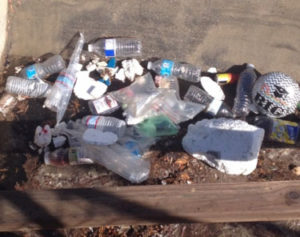
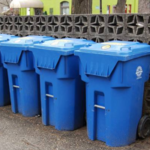 What should I do with all of the plastic bags I’ve saved under my kitchen sink?

 Climate change: Despite the consensus of the vast majority of the scientific community that man-made climate change is very real, the issue remains a contentious topic for federal legislators, and a key policy area to watch going forward. The choice of a
 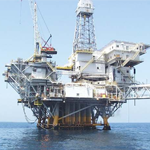 Energy: Strongly tied to U.S. actions on climate change are our energy policies in general, which may have additional impacts on natural resources and air and water pollution. Here on the California coast in particular, we’ll be watching out for any policies or actions that may open up our lands, in particular those offshore, to additional oil drilling and fracking. We’ll also look out for actions on recently adopted or still in the works policies such as the Clean Power Plan and mercury standards that seek to tighten standards on a range of air and water pollutants. These obviously have enormous potential impacts on the health of our local waterways and neighborhoods.
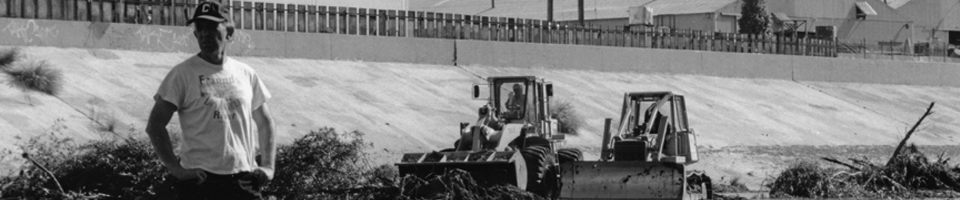
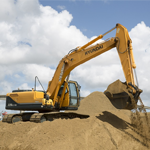 Infrastructure spending: Given the current degraded state of our infrastructure, Heal the Bay supports