

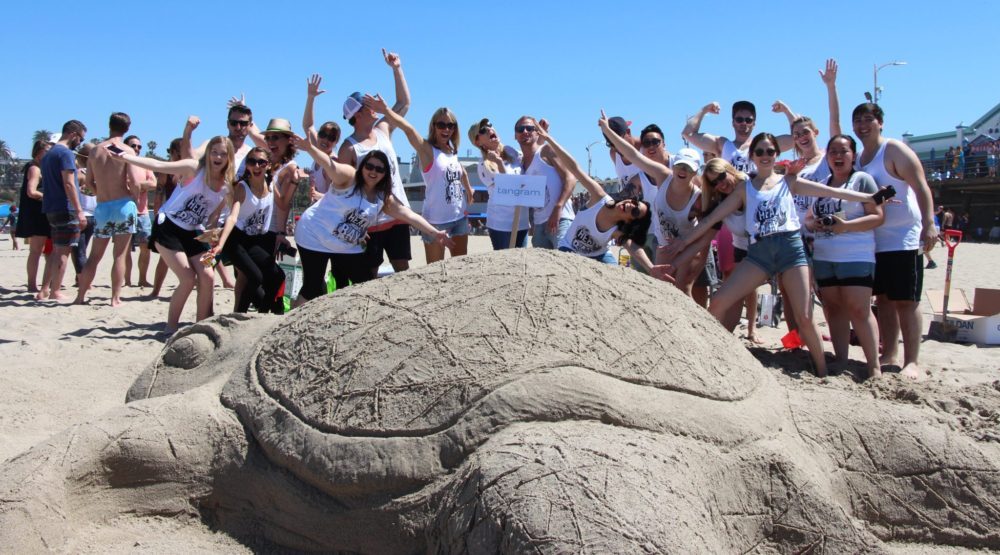
Heal the Bay has found a unique way to draw attention to the new administration’s attack on climate change science – a sea turtle with a ninja star.
The inspiring March for Science at cities around the nation has concluded, but the fight for rationality and reason lives on.
Many scientists and researchers working in the environmental field around the country feel as if they have a bulls-eye painted on their back – from the very government that has funded their important work for decades.
The new federal administration’s plan to curtail climate change research and to slash funding for the Environmental Protection Agency has stoked deep concerns in the nonprofit world.
But Heal the Bay isn’t sitting by quietly. We’re getting quite animated about the issue – literally.
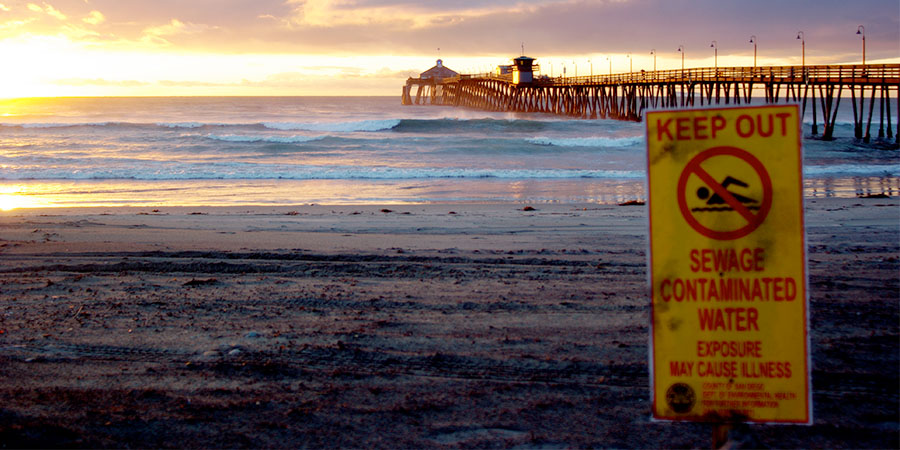
Today, we launched a 60-second PSA to rally digital advocates across the country to petition their Congressional representatives to oppose proposed budget cuts to EPA programs and staff. Public dissent is critical to ensure that essential air- and water-quality safeguards and habitat protections are not abandoned by climate deniers sitting in positions of federal power.
Heal the Bay’s partners in the advertising and animation industries shaped the spot, dubbed “Nature’s Revolt,” as part of a new creative coalition called Our Next 4 Years. Ironically riffing on over-the-top TV cartoon violence, the video offers a humorous take on marine animals fighting fire with fire.
Sarah May Bates, a veteran creative director in the advertising agency world, served as writer and art director on the spot, working with Matthew King, Heal the Bay’s communications director. Scott Graham provided animation, storyboards and character designs. (Full credits are below.)
“Climate change is a huge downer, but the EPA plays an essential role in sustaining this planet in the face of it,” Bates said. “To make a dire message more palatable, we imagined a scenario in which nature could fight back. At the very least, a crab with a rocket launcher can make an important message more engaging.”
Heal the Bay asks “Nature’s Revolt” viewers to take action and add their name to the Change.org/ProtectOurOceans petition seeking continued funding for climate programs at the EPA and the National Oceanic and Atmospheric Administration. To date, nearly 75,000 ocean-lovers have added their signatures to the Heal the Bay-sponsored petition, covering every state and major overseas territory in the United States.
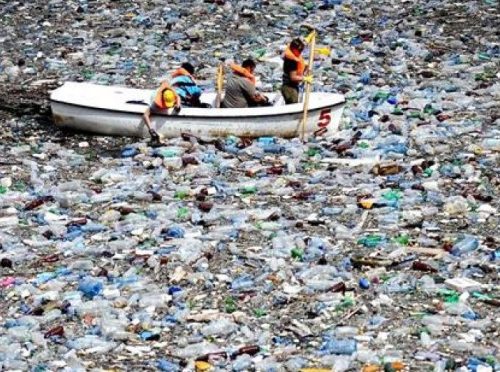
Bates previously collaborated with Heal the Bay on “The Majestic Plastic Bag,” the BBC-style nature mockumentary that has been viewed more than 2.3 million times on YouTube, and featured in environmental conferences and classrooms around the world.
Our Next 4 Years is a collective of nearly 300 animation professionals (Emmy- and Oscar- nominees among them) who are donating their creative talents to produce animated PSAs for progressive causes that will be negatively impacted by policies put forth by the current administration.
“For each attempt to roll back hard fought social and economic gains won over the past 70 years, we will fight back with messages to help stem the regressive tide,” said Mike Blum, owner of boutique animation studio Pipsqueak Films. He is one of the co-founders of Our Next 4 Years, along with veteran animation producer Carolyn Bates.
Production teams are matched with other nonprofits to create virtual animation studios in order to tackle causes, including the environment, immigrant rights, affordable health-care, government reform and religious tolerance.
“So often, animated PSAs are out of reach of charities and community organizations, because we move fast and don’t have the long lead time that many animation houses insist on,” said Jayde Lovell, director of film and video for March for Science. “But working with Our Next 4 Years was incredible. They really brought our ideas to life in meaningful, funny and emotional pieces in a week’s time!”
The coalition has debuted eleven videos to date, including “Nature’s Revolt.” In just a few days, the four videos they released in time for Earth Day and March for Science have a combined reach of more than 600,000 people on Facebook. You can watch other videos here.
Full Credits: “Nature’s Revolt”
Animation, Storyboard & Character Designs:
Scott Graham, ScottGraham.carbonmade.com
Creative Director/Writer:
Sarah May Bates, SarahMayBates.com
Backgrounds:
Carolyn Arabascio
Animal Character Designs:
Regie Miller, MyNameIsRegie.com
Text Animation:
Daniela Fernandes Smith
Music:
Jeremy Simon, FurnivalMusic.com
Producer:
Carolyn Bates
Production:
Our Next 4 Years


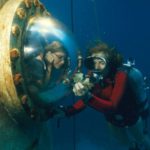 The April 2017 Malibu Library Speaker Series has a special treat in store for Earth Month. Dr. Sylvia A. Earle, world renowned oceanographer, explorer, author, diver, and former chief scientist of NOAA (among many, many other brilliant things) will speak about her extraordinary experiences.
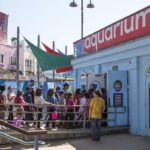
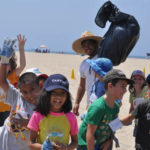
 Even in urban settings the natural environment is all around us, sometimes hidden in plain sight. Exploring and documenting nature in cities is critical, which is why we rely on citizen science to sustain and grow our knowledge. What better way to celebrate National Citizen Science Day on 4/15 than to rep Los Angeles in the the City Nature Challenge 2017? Roll up your sleeves, whip out your cellphone or camera, and go for a walk outside to help Los Angeles get smarter about its natural environment. Over a dozen U.S. cities are competing to see who can observe the most nature from 4/14-4/18. PS – When you are documenting species, please be mindful not to disturb the wildlife and habitat.
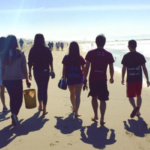


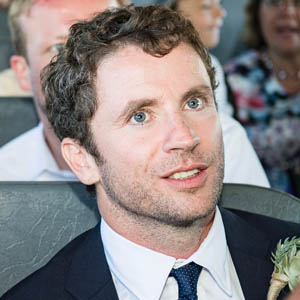 While David was getting his masters in Marine Biology, he came to realize that while he is passionate about nature, he’s not really a scientist (endless data analysis, tedious academic journals, etc. – bo-ring!). However, he learned he loved public speaking. Through Speakers Bureau, he continues to use his Marine Biology training in a format that fits his personality and interests. In fact, he has been a guest speaker at over 30 beach talks and lectures since first joining the program in March 2015! He uses his speaking talents to communicate his love of nature to a diverse audience- to inspire people to care about the ocean. Opening up with video footage of dives he did for his thesis research, he gets the room excited while breaking the ice. David is one of our most consistent volunteers to go into the classroom and educate students and adults alike. He reaches out on the regular to volunteer, and can always be counted on when we ask him for help. David is an exemplary reason that the Speakers Bureau program is so successful, reaching out to 40,000 Angelenos annually. Thank you David, for your passion and commitment, for inspiring ocean stewards for years to come.
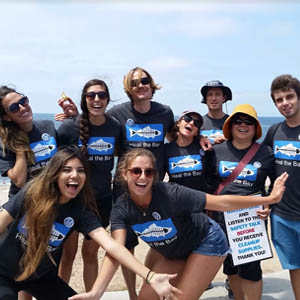 (Almost) Immediately after flying into LAX from South Korea in 2014, Zeph volunteered for his first Nothin’ But Sand cleanup at Dockweiler Beach, and nothing has been the same since. Although Alys Arenas was yet to be hired as HtB’s nefarious Beach Programs Manager, Zeph still knew in his heart of hearts that he wanted… nay, NEEDED!… to get more involved. One volunteer training later, he emerged as a newly-minted Beach Captain — capital letters and all (but, sadly, no cape or captain’s hat) — ready to help turn the tide (pun!) on pollution. Donning his super HtB t-shirt (because, again, no cape), Zeph tirelessly sets his alarm every 3rd Saturday of the month (except for December, of course!) and helps erect tents, build tables, and direct humans. Yes, he WILL take care of that needle you found. Of course he’s fine picking up that condom you simply cannot touch. But, no, that dead seagull must not be disturbed, nature taking its sweet time to reclaim it once more. Although Zeph mostly enjoys working the supply tent because of the power it brings him, he’s acquired other super powers over the years, assisting where needed, including packing/unpacking the truck at HtB headquarters, giving safety talks, harassing other HtB staff, and holding the coveted raffle jar! His favorite saying? It’s this: “Most of the trash at the beach is coming from somewhere else, so picking up litter in your own neighborhood is like doing a mini beach cleanup every day.” Copyright. Trademark.
 When you think of Jeri Miller, you automatically think of a Wednesday Warrior. Whether she’s inputting those tedious safety waivers or helping bundle cleanup supplies, Jeri’s outgoing spirit always brightens the Large Conference Room on Wednesdays. Her academic background, vocational interest and true passion center around the environment, particularly the marine environment. When she joined the Office Support team in 2015, she was on a break from work and wanted to contribute to an organization she felt was making a difference. It was here at Heal the Bay, that she felt inspired by the variety of volunteer opportunities, the people and the vibe of the office. To her, the office is such a chill place to be at, yet there is still that buzz generated by a group of people committed to doing what they believe in. When she’s not helping at HtB, you can catch her volunteering for Reef Check Foundation – she’s since been hired by them on a part-time basis! Her other hobbies include working out, working out, and working out — swimming, walking the beach, going to the gym, riding her beach cruiser everywhere and yoga. When its’ not Wednesdays, she also manages to find time to hang out with friends at any one of the many local Redondo Beach bars and restaurants!
 Erin was inspired to volunteer with Heal the Bay years ago by her mom, Lollie, who teaches at CSULA and has someone from the organization come speak to her class every quarter. Erin knew she wasn’t quite ready to volunteer in a formal classroom setting, so she decided to join the Community Advocates (Street Fleet) crew in 2014. When she’s out tabling, Erin enjoys the ability to reach out to people and teach them about the small, simple changes that can be made to help protect and preserve our ecosystem. Being part of the Street Fleet crew has allowed her meet other amazing and wonderful volunteers and staff that share their passion and knowledge of the environment with her. When she’s not volunteering with HtB, Erin spends some time with several animal rescue organizations and shelters with adoption events, humane Education programs, fostering, and mentoring new pet parents. She spent part of last year volunteering as a summer camp director working with kids 8-17 as well as mentoring young adults as counselors. Her other year-round volunteering activities include working with people in jails that are trying to get/stay sober. What’s her favorite thing of all when she’s not at work or any community service events? Snuggling and spoiling her 4 dogs.
 Mary is one of Street Fleet’s go-to volunteers. Having retired a couple of years ago, Mary knew she wanted to find something where she could make a difference, meet new people and learn new things. As a long-time Hermosa Beach resident, she feels very fortunate to live in such a beautiful place and decided helping Heal the Bay would be a good use of her time. She began her journey as an HtB volunteer by helping phone bank for the campaign to stop oil drilling in Hermosa. Soon after joining the Street Fleet Crew in 2015, Mary realized that she enjoyed talking to all the different people who visit the HtB table at the fairs and events. The other volunteers she tables with are great too. Since becoming a volunteer, Mary has learned so much about LA water. More importantly, she loves that the Heal the Bay staff are always so welcoming. When she’s not volunteering with HtB, Mary also volunteers for an education organization called “Families in Schools.” Their mission is to work with schools to involve parents and communities in their children’s education to ensure lifelong success. She also recently started tutoring ESL through the South Bay Literacy Council.
 As a high school and college teacher for Santa Monica High School and Santa Monica College, Mr. Kay has acted as a longstanding advocate for and steward of the Santa Monica Bay. His involvement with Heal the Bay spans upwards of 10 years, in which time he’s steered his students towards the aquarium, beach cleanups, community eco-events, and youth summits, all while spearheading and mentoring Team Marine and partnering for programs such as Day Without Bag Day, No on O phone banking, STEAM Rube Goldberg Machine Contest, and RETHINK eco-artwork campaign. He’s taken student advocacy to the streets by participating in six SaMoHi plastic bag ban marches, and to the government by bringing students to testify for sustainable solutions at city halls all over LA County and to lobby in Sacramento on Ocean Day. For his unwavering commitment to inspire environmental stewards for over a decade, we are honored to present him with the Super Healer Award for an outstanding Community Leader. Thank you for your service Mr. Kay!
 Sasha was a high school student when she first started as an aquarist intern, and now she is in the middle of her first year at UCLA. I knew she was very intelligent, and participated in 3,000 different extracurricular activities in high school, and that number has only increased, now that she in college. But what is surprising to me is her positive outlook on life. Even though she has gone through some hardships, she always looks on the bright side, like how she had curly hair for a while, how fun the children’s ward of the hospital is, and how she got to go to Antarctica and jump in the ocean afterwards. She is usually very cheerful (after a morning cup of coffee or tea), even when she has a terrible migraine, and may seem carefree, but she is one of the hardest working people I have ever met. She is not afraid to take charge and be the boss (in her own quiet way), and I know she will do great things in the future. So, I want to thank you on behalf of Jose and I, for all that you do for us, my fellow lover of the oxford comma, Sasha. – Akino Higa, SMPA Aquarist
 Grace Luis is like the Swiss Army knife of volunteers. She began her volunteer service almost 2 ½ years ago at the Aquarium, and since then has donated over 1,500 hours of time (even with her busy school schedule) in practically every program we offer at the Aquarium. Whether she is helping to train and guide new volunteers, introducing marine science to preschoolers, entertaining delighted birthday kids and their friends with animal presentations and fun stories, or helping to design fun new activities/displays for the Aquarium, Grace has always brought her friendly smile and incredibly funny sense of humor to any situation. We have all joked about locking Grace in the Aquarium after she graduates so she could stay with us forever—she not only donates so much of her time/service; she also shares her dedication, passion and kindness with everyone she meets. Grace exemplifies what we look for in a Super Healer, and we are so honored to work with her each week.
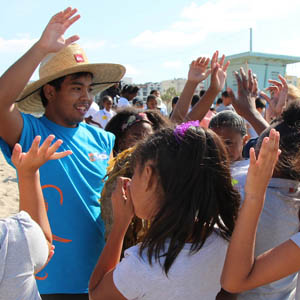 Juan loves cars. He builds them, races them and fixes them when they break. His other passion is the ocean and he matches his same love of cars with the watery world he surfs on, wades in and helps students understand. This past year we have watched Juan grow from a volunteer, who devoted four days a week to help us teach students about the ocean, to an intern, then summer camp intern and finally as a Key to the Sea Naturalist. He took the direction we gave him to heart, fine-tuned his deliveries and developed his own teaching style, making him an important part of our education team. We have the great fortune of working with many wonderful education interns and volunteers, but Juan pushed himself to grow and learn, and always did it with his trademark smile and laugh. He always steps up when needed and helps the other volunteers grow themselves. Juan has developed so much as an educator, he has found himself teaching at the Roundhouse Marine Studies lab and Aquarium three days a week, yet still comes in to work with us on his free days… a true commitment to educating others about a place that brings him so much joy, the ocean!
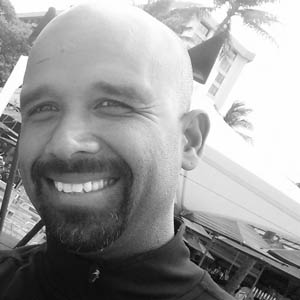 “I simply wanted to do some good and looked for a cause that I cared about. Growing up in the Pacific Northwest, I’ve always enjoyed the outdoors & nature so environmentalism was a natural fit for me. In searching for a volunteer opportunity, I looked for an organization that shared my passion, had a track record of community engagement, and who used the majority of their funds for actual programs rather than administrative and fundraising expenses. I found all of this in Heal the Bay. Being outdoors while contributing my small part to positively impacting our beautiful coastlines. I never get tired of the sun (remember I’m from the Pacific Northwest) so when I’m conducting an MPA survey its more than just a survey, its a walk on a nice sunny day 🙂 I also volunteer for Tree People and Habitat for Humanity when I have the time. In terms of hobbies, I enjoy surfing, hiking, and running.”
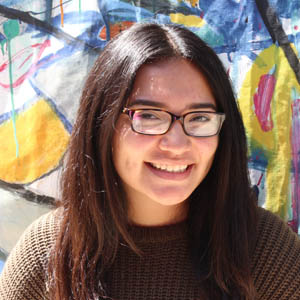 Brittney Mercado, a senior at Da Vinci Communications High School, has been passionate about the environment throughout her life. She knows that it is her future at risk and the only way to make a difference is to let her voice be heard. She did just that by coming to our advocacy training session, and then used her voice to spread information about the Yes on Prop 67 campaign. She organized her friends to call people across Los Angeles at our phone banking events and to walk door-to-door in their Hawthorne neighborhood to canvass for the cause. She wrote a fantastic article in her school’s newspaper to inspire her classmates to use their voices as well. She is certainly a great voice for the environment and will set an example for her generation and generations to come.
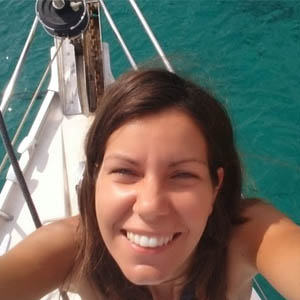 “I love the ocean and I had such a happy times with my elder son in the aquarium, it made sense to give back in both fronts. The sense of community and the fact that you can make a difference. I thrive by continuously learning new things and I like to surf. I love the ocean in all of its ways, I enjoy sailing, swimming, playing in the sand… going to the beach to stroll or just to look for little creatures (or big!) with my family. I enjoyed the sea salty air and the ever changing shades of blue.”
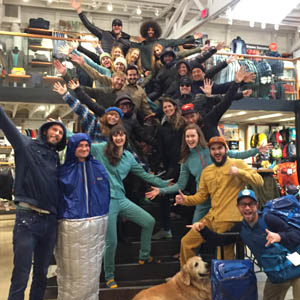 Patagonia believes in building the best product, causing no unneccesary harm and using business to inspire solutions to the environmental crisis. The brand donates 1% of all sales to grassroots environmental causes, and the 4th Street location in Santa Monica has been proud to partner with Heal the Bay all these years.
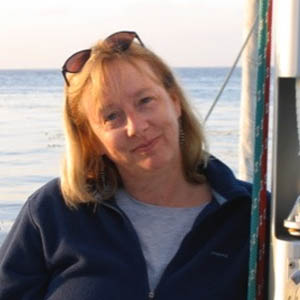 Erin Selleck was first introduced to Heal the Bay through her husband and longtime friend of the organization, Kurt Holland. Kurt is an environmental education consultant and former marine science teacher at Santa Monica Alternative School House. Both avid sailors with a life-long love of the ocean, they took a three year sabbatical and fulfilled a lifelong dream to cruise the oceans in their 41 foot sailboat. Kurt’s passion for the Santa Monica Pier Aquarium was contagious and ultimately led Erin to join the Heal the Bay Board of Directors in 2009.
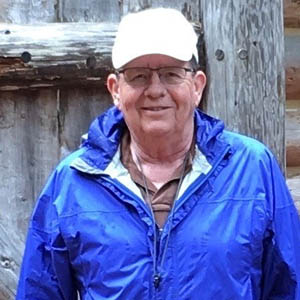 When Doug first joined HtB he was working in an office, and was looking for volunteer work that was outdoors. MPA watch perfectly fit the bill. Wanting to spread the word, he later joined Speakers Bureau and started doing outreach. He’s favorite thing is talking about the ocean to kids. Doug retired a year ago, and when not spreading the word for HtB, he spends most of his time doing volunteer work for the American Red Cross.
 Leslie Mintz Tamminen is a consultant for Seventh Generation Advisors, a nonprofit environmental organization in Santa Monica CA. She is the Director of the Ocean Program, and in this capacity she facilitates the Clean Seas Coalition nationwide, a growing group of environmentalists, scientists, students, and community leaders pushing states to strengthen laws reducing plastic pollution at its source. Leslie spearheaded Clean Seas Coalition efforts to create and pass California’s SB270 law to ban single-use plastic bags. Formerly, Leslie was a special advisor to Lt. Governor John Garamendi, and the Legislative Director and staff attorney for the California environmental nonprofit organization Heal the Bay, where she was responsible for development and implementation of statewide water quality regulation and legislation, including the first federal pollution limit for trash in an urban river (Los Angeles). Leslie also worked to pass and implement California’s Education and the Environment Initiative, a state requirement for environmental education principles and curricula development in all core disciplines in public schools for K-12. Leslie is currently appointed to California Superintendent of Public Instruction Tom Torlakson’s Environmental Literacy Steering Committee, tasked with implementing the 2015 Blueprint for California Environmental Literacy. Leslie is a graduate of the University of California at Berkeley, and the University of Southern California Law Center, and lives in the Los Angeles area with her husband Terry Tamminen.