Top

Heal the Bay Blog

Category: Malibu / Pacific Palisades

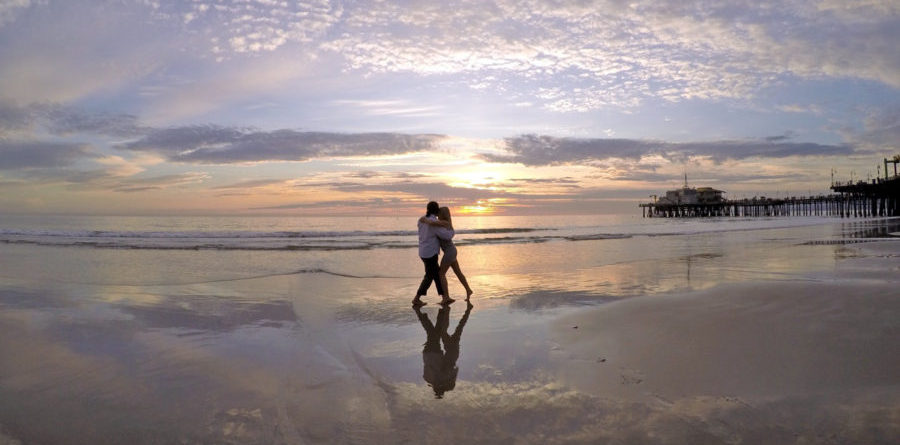
Through the end of December, we will share the stories of amazing people whose lives have been changed by Heal the Bay. Now they are changing our region for the better. Please make your Year-End Gift today to support the work of these water warriors.

Ken Seino almost died surfing at Malibu’s fabled First Point.  First he was scared, then he was angry. Then with Heal the Bay’s help he took matter into his own hands – flying to Sacramento with us in 2009 to fight successfully for stricter pollution limits. Here’s his story in his own words:

Call me biased, but from the first time I surfed the place, I knew Surfrider Beach was special – dare I say sacred? But the continuous human pollution from Malibu Creek eventually played Russian Roulette with me and it won. I suffered a prolonged illness from a fecal virus contracted surfing here and I almost died from it.  The disease damages the heart muscle and even causes your own immune system to weaken you. It is irreversible.

Two surfer friends of mine did die from the very same virus here.  They asked me to help them fight for its restoration to the pure and holy place that the Chumash tribe ascribed it to be. In order to honor my friends and honor this place, how could I refuse?

As a member of the Malibu Surfing Association and a Surfrider Beach regular since 1971, I was asked by MSA president Michael Blum to accompany the “A-Team” to Sacramento and speak before the State Water Board.

The State Board was weighing in on whether to support the Regional Water Board’s earlier prohibition of on-site wastewater plants in the Malibu Civic Center area. Opposition to the action was strong with Malibu’s city attorney actually threatening litigation if the State Board upheld the prohibition, which aimed to prevent seepage of harmful bacteria from outmoded septic tanks.

I had heard of last-minute strategies by the city of Malibu to have the septic ban remanded to the L.A. Board because of its contention that the prohibition was “technically unfeasible and politically unachievable.”

So I was worried as I walked into the State Water Board hearing room and sat next to my esteemed teammates. We each spoke, with [former HTB president] Mark Gold wrapping up succinctly all of the issues at stake. We sat down, hoping and praying that our words persuaded the five-member board that would make the final decision.

The city of Malibu arrived with its own A-Team. Euphemized threats of litigation were uttered and Mark Gold was gratuitously misquoted.  I hoped that the board would see through this.  Other opponents spoke as well. The residents and commercial interests complained how oppressive the ban would be to them personally.

But suddenly, after the last speaker had appealed, the board called for the vote.  And in a few minutes, a unanimous vote (5-0) in our favor was recorded.  About 90% of the room vacated as the board moved on to other business.  We sat there together silent, staring straight ahead, stunned.  All these decades of activism, protest and creation of organizations to fight this breach upon the environment and public health, and now the victory had finally been achieved. Is this how it felt at Waterloo?  Mark Gold got up from his chair, looked at us and said, “What, did someone die? Hey, we won!”

It didn’t hit me personally until I was on the plane staring out the window as we were coming home.  I thought about my own fight for this place I love, and also about Ralph Gambina and Erik Villanueva who died from infections from surfing Malibu.  They were vocal in insisting upon this ban of septic tanks in Malibu. This is what they fought for and it is finally a reality.  As I stared out the window of the plane at the glistening ocean, I cried for Malibu, but this time they were tears of joy.


Make a Year-End Gift to Heal the Bay

Our work isn’t possible without the real passion, action and commitment from people like Ken and you. Help us spark more positive change in our region, up and down the coast, and around the world.


The waves curl and crash ashore before slowly bubbling back to sea, a potion of water, foam and sand. The light of the full moon grazes the sandy beach at its feet while a bright Pacific breeze wanders through the night. There’s an air of romance. Thousands of wild fish certainly got the memo as they flop and dance around on the beach, performing one of nature’s most exceptional reproduction rituals.

If you’ve never witnessed a grunion run, you’ve been missing out on a classic Southern California beach tradition! Tonight and over the next few weeks you will have the rare opportunity to spot grunion coming to spawn.

Heal the Bay’s Marine Scientist Dana Murray answers some common questions about these special fish:

What are grunion?
Grunion are a sleek, silver fish that are most well known for their unique spawning behavior. These charismatic 6” fish surf the waves to shore, flop onto land to lay and fertilize eggs in the moonlight on our local beaches. Grunion are found in California (including Baja) and nowhere else in the world!

Why do they come to shore?
Grunion come to shore to lay their eggs at high tide. Spawning on sandy beaches, their eggs remain buried in the sand where they incubate for about two weeks until the next high tide comes and they hatch and return the ocean. The premier grunion expert in the world, Dr. Karen Martin, has written a book, “Beach-Spawning Fishes: Reproduction in an Endangered Ecosystem,” where you can read all about these fascinating fish.

When is the best time to try and see them?
At nighttime high tides during the spring and summer. Grunion may run as early as March on into September but peak season is from the start of April through June. Runs typically occur for a few nights after the highest tides during full and new moons. Your best chance to spot them is to plan ahead and stay out on the beach for an hour or so on either end of high tide.

Consult this grunion run 2017 schedule for the best times to observe these “silver surfers.”

What So Cal spots are best to try and spot them?
All you need is sand and a very high tide at night during grunion season! In the greater Los Angeles area, good grunion run locations include Surfrider in Malibu, Cabrillo Beach in Santa Pedro, Santa Monica State Beach, Hermosa Beach and Venice Beach.

What can I expect to see?
Although grunion sightings are never guaranteed, with a keen eye you can increase your chances. Look for predators such as black-crowned night herons or raccoons waiting for the surfing silversides along the shore. Some grunion runs are just a few scouts flopping onto the beach, whereas other runs involve thousands of fish, covering the wet sand entirely!

What should I do to prepare?
Bring warm clothes, your patience and a friend to walk the shoreline with. Leave your dog at home, and come knowing that as with any wildlife it’s a chance and not a guarantee that you’ll see them.

Are there things I shouldn’t do?
Do not to touch or interfere with spawning – especially during closed fishing season (April and May). Also, don’t shine lights on the water or grunion as it can interfere with their spawning, as can loud talking and noisy crowds.

Are grunions doing well? Are they in danger in any way?
The grunion population is believed to have decreased, so it’s important to protect them during spawning for the future population. Leaving domestic predators like dogs at home is advised, as canines may devour the eggs or disturb the fish. Also, not disturbing the buried grunion eggs along the high tide line after a spawning event helps ensure that grunion remain around into the future.

Dr. Karen Martin from Pepperdine University regularly works with and trains beach groomers to avoid the high tide line in grunion season, so as not to disturb eggs. Beach grooming operators now follow a specific protocol during grunion season to avoid disturbing sand where grunion eggs incubate.

How can I help grunion?
Observers of grunion runs are urged to report the time and location of the run for scientific purposes for Grunion Greeters.

Try not to disturb spawning grunion, and encourage others to do the same. During open season, follow the Fish and Game Regulations (which include not using any form of gear, nets or traps – only bare hands) and encourage observation or “catch and release.”  If you observe poaching or any violations of grunion fishing regulations, such as use of gear or nets, please advise the California Department of Fish and Game or call 1-888-DFG-CALTIP.


Leslie Griffin, Heal the Bay’s chief water quality scientist and Beach Report Card manager, likes to kiss and tell. Here’s her list of the cuddliest spots for couples along the California shoreline.

Wanna enjoy a long walk on the beach?

I know it sounds like a line, but this lovers’ activity is a cliché for a reason. A seaside stroll proves both calming and romantic, with the vast ocean rippling along the shore while your toes sink into the cool sand. Or maybe your dream beach date consists of gazing at a gorgeous sunset while you enjoy a seaside picnic.

Either way, we are all about getting a little sandy, whether with a loved one, a friend, or for a little solo escape into the outdoors for some dedicated me time.

Here are 10 spots we love for love (and their great water quality too!):

Torrey Pines, San Diego

Source: Dan_H, flickr

What we love about it: Torrey Pines State Beach has picturesque views of the San Diego coastline and the adjacent Torrey Pines State Reserve is filled with little trails leading down to the shore. We recommend that you only take marked trails and watch your footing, but the views are worth the adventure.

What to do here: We love the Torrey Pines Trail to Black’s Beach in the morning for a beautiful way to start your day. Fair warning: some nudists like to visit this beach as well.

Water Quality: The only sampling site at Torrey Pines is at the Los Penasquitos Lagoon outlet. That site received good grades in our most recent annual Beach Report Card.


La Jolla, San Diego

Source: Wikipedia Commons

What we love about it: This spot is great for lovers and families alike, with plenty of adventure to be had by all ages.

What to do here: This is the perfect spot for a SUP (stand up paddleboard) adventure, snorkeling, kayaking, or even just a picturesque walk along the beach. For stunning ocean views over dinner, check out the Marine Room at the La Jolla Beach and Tennis Club.

Water Quality: La Jolla shores received great grades in our annual report last year.


Victoria Beach, Orange County

Source: Daniel Peckham, flickr

What we love about it: Straight out of a fairy tale, this shoreline spot is guarded by La Tour, a 60-foot castle-inspired tower.  Built in 1926, the structure provided beach access for a home on the cliff above.

What to do here: Looking to be someone’s knight in shining armor? Look no further. To get here, walk to the north end of Victoria Beach in Laguna Beach, around the bluff and past another sandy section of beach. (This is a privately owned structure, so while you can walk up to it, please do not try to go inside or climb on the structure.)

Water Quality: Victoria Beach received A+’s across the board in our last annual report.


Crystal Cove State Park, Orange County

Source: Wikipedia Commons

What we love about it: With such a long swath of open sandy shores, this is an ideal spot for a romantic seaside stroll, or perhaps for a love-inspired photoshoot.

What to do here: If you’re looking for post-beach walk eats with an ocean view, the Beachcomber Café is a fun option.

Water Quality: Crystal Cove has great water quality in the summer or whenever the weather has been dry. Given the buckets of rain we have (thankfully) gotten this year, make sure to heed any beach posting signs you may see.


Palos Verdes Peninsula, Los Angeles

Source: Mark Esguerra, The Marke’s World

What we love about it: We love the PV areas so much, we had to lump the whole peninsula together as one of our top locations. Palos Verdes wraps around from the base of the South Bay down to San Pedro, and features beautiful neighborhoods, coastal trails, clean beaches, and tidepool adventures.

What to do here: If you’re looking for some marine biology-inspired adventure, time your visit for low tide to go tidepooling at Abalone Cove. For a short hike and a hidden rocky beach, check out Palos Verdes Bluff Cove.

Water Quality: The Palos Verdes area is home to multiple Honor Roll beaches, including Abalone Cove Shoreline Park.


El Matador State Beach, Malibu

Source: Elliot McGucken, 500px

What we love about it: This was easily the top rated romantic spot by Heal the Bay staff. Dramatic cliffs and coves (and even secret sea caves) make this beach feel like the backdrop of a steamy Hollywood romance scene. Whether it’s energizing a new flame or a longtime squeeze, you can expect El Matador to light your fire.

What to do here: Explore the dramatic landscape, take Instagram-worthy photos, find little hideaway spots for you and your date to share secret kisses, and wrap up your evening with a gorgeous sunset view.

Water Quality: El Matador is an Honor Roll beach with awesome water quality.


Arroyo Burro, Santa Barbara

Source: Damian Gadal, flickr

What we love about it: Santa Barbara is the perfect little getaway for a weekend of romance. If you’re looking for some time together to rest, rejuvenate, and rekindle the fire, Santa Barbara is the perfect place.

What to do here: We love Arroyo Burro for a sunset walk, and with plenty of parking and restroom access it’s a stress-free beach walk experience.

Water Quality: Arroyo Burro has great water quality in the summer or whenever it has been dry enough that the creek hasn’t breached. Make sure to heed any beach posting signs you may see if you’re feeling like taking a dip. But if the creek is flowing, be sure to stick to the sand over the waves.


Big Sur Coastline, Monterey

Source: Wikipedia Commons

What we love about it: Another area that is just so beautiful, we can’t limit it to just one beach. The shoreline in Big Sur is renowned for its rustic coastal beauty. A drive along the twisty coastline is certain to inspire awe. Pull off whenever your heart desires, and be sure to take photos so you can revisit the view whenever you like.

What to do here: McWay Falls is a stunning spot where you can watch a perfect little waterfall pouring directly to the beach. The Bixby Canyon Bridge is another cult favorite, and there’s even a Death Cab for Cutie song to match. There are plenty of hiking trails, camping sites, and little cafes to warm up in.

Water Quality: Monterey water quality testing only extends as far south as Carmel, so while there aren’t any sampling sites to rely on, the area is un-urbanized and thus less likely to have bacterial problems.


Baker Beach, San Francisco

Source: Wikipedia Commons

What we love about it: If you’re in the Bay Area and looking for an ideal view of the Golden Gate Bridge, this is our favorite sandy spot.

What to do here: The dramatic backdrop makes this spot ideal for a photo shoot, or even just a quick selfie-sesh. We’d recommend cuddling up for a romantic picnic and enjoying the sunset together.

Water Quality: Just be sure to avoid swimming near the creek outlet if you’re looking to take a penguin dip.


Point Reyes National Seashore, Marin County

Source: Wikipedia Commons

What we love about it: The farther north you go in California, often the more dramatic and rural the coastal landscape. This National Seashore is a prime example of that raw beauty, and it is sure to take your breath away.

What to do here: There a quite a few campgrounds and hiking trails within the area if you’re looking to get back in touch with nature.

Water Quality: Marin County no longer samples within this area. The closest active sampling station is Bolinas Beach (another beautiful spot), just south of Point Reyes.


Heal the Bay’s Beach Report Card is the only comprehensive analysis of coastline water quality in California. We monitor more than 500 beaches weekly from Oregon to the Mexico border, assigning an A to F grade based on the health risks of swimming or surfing at that location.


For 2017 grades, please see our River Report Card.

Heal the Bay’s inaugural study of Los Angeles River microbial water quality that we published July 27, 2016 and last year’s study on swimming holes in the Santa Monica Mountains called for more readily available public water quality information. The public has a right to know about water quality conditions in these freshwater recreation areas so that they can make informed decisions on how to minimize the risk of getting sick.

We will be posting an update every Friday during the summer with water quality information from our weekly sampling of freshwater recreation sites in Los Angeles County.

Malibu Creek State Park – Number of Exceedances
Site Name9/29/169/21/169/15/169/7/168/31/168/24/168/17/168/10/168/3/16
Rock Pool0 out of 4

None of the four criteria exceed the threshold values this week at Rock Pool site in Malibu Creek. The single sample E. coli value was below the threshold of 235 MPN/100ml, and the geometric mean for E. coli was below 126 MPN/100ml. The single sample Enterococcus value was also below the threshold of 110 MPN/100ml as was the geometric mean value for Enterococcus (below 30 MPN/100ml). Since June 15, 2016, we have documented exceedance rates (for single samples) of 20% for E. coli and 13% for Enterococcus at this site.
0 out of 4

None of the four criteria exceed the threshold values this week at Rock Pool site in Malibu Creek. The single sample E. coli value was below the threshold of 235 MPN/100ml, and the geometric mean for E. coli was below 126 MPN/100ml. The single sample Enterococcus value was also below the threshold of 110 MPN/100ml as was the geometric mean value for Enterococcus (below 30 MPN/100ml). Since June 15, 2016, we have documented exceedance rates (for single samples) of 21% for E. coli and 14% for Enterococcus at this site.
0 out of 4

None of the four criteria exceed the threshold values this week at Rock Pool site in Malibu Creek. The single sample E. coli value was below the threshold of 235 MPN/100ml, and the geometric mean for E. coli was below 126 MPN/100ml. The single sample Enterococcus value was also below the threshold of 110 MPN/100ml as was the geometric mean value for Enterococcus (below 30 MPN/100ml). Since June 15, 2016, we have documented exceedance rates (for single samples) of 23% for E. coli and 15% for Enterococcus at this site.
1 out of 4

Only one of the four criteria exceeds the threshold values this week at Rock Pool site in Malibu Creek. The single sample E. coli value was below the threshold of 235 MPN/100ml, and the geometric mean for E. coli was below 126 MPN/100ml. The single sample Enterococcus value was also below the threshold of 110 MPN/100ml but the geometric mean value for Enterococcus was over the threshold of 30 MPN/100ml. Since June 15, 2016, we have documented exceedance rates (for single samples) of 25% for E. coli and 17% for Enterococcus at this site.
1 out of 4

Only one of the four criteria exceeds the threshold values this week at Rock Pool site in Malibu Creek. The single sample E. coli value was below the threshold of 235 MPN/100ml, and the geometric mean for E. coli was below 126 MPN/100ml. The single sample Enterococcus value was also below the threshold of 110 MPN/100ml but the geometric mean value for Enterococcus was over the threshold of 30 MPN/100ml. Since June 15, 2016, we have documented exceedance rates (for single samples) of 27% for E. coli and 18% for Enterococcus at this site.
2 out of 4

Two of the four criteria exceed the threshold values this week at Rock Pool site in Malibu Creek. The single sample E. coli value was below the threshold of 235 MPN/100ml, and the geometric mean for E. coli was below 126 MPN/100ml. In contrast, both the single sample and geometric mean values for Enterococcus were over their respective thresholds. Since June 15, 2016, we have documented exceedance rates (for single samples) of 30% for E. coli and 20% for Enterococcus at this site.
1 out of 4

One of the four criteria exceeds the threshold values this week at Rock Pool site in Malibu Creek. For both E. coli and Enterococcus, the single sample values were under their respective thresholds. The geometric mean value for E. coli was under its threshold, while Enterococcus was over its threshold. Since June 15, 2016, we have documented exceedance rates (for single samples) of 33% for E. coli and 11% for Enterococcus at this site.
2 out of 4

Two of the four criteria exceed the threshold values this week at Rock Pool site in Malibu Creek. For both E. coli and Enterococcus, the single sample values were under their respective thresholds but the geometric mean values were over the thresholds. Since June 15, 2016, we have documented exceedance rates (for single samples) of 33% for E. coli and 12% for Enterococcus at this site.
3 out of 4

Three of the four criteria exceed the threshold values this week at Rock Pool site in Malibu Creek. For E. coli, the single sample and geometric mean values were over threshold values; the single sample Enterococcus value was under the threshold of 110 MPN/100ml but the geometric mean value was over the threshold value. Since June 15, 2016, we have documented exceedance rates (for single samples) of 43% for E. coli and 14% for Enterococcus at this site.
Las Virgenes Creek at the Bridge1 out of 4

Only one of the four criteria exceed the threshold values this week at Las Virgenes Creek at the bridge. The single sample E. coli value was below the threshold of 235 MPN/100ml, and the geometric mean for E. coli was below 126 MPN/100ml. The single sample Enterococcus value was also below the threshold of 110 MPN/100ml but the geometric mean value for Enterococcus was over the threshold of 30 MPN/100ml. Since June 15, 2016, we have documented exceedance rates (for single samples) of 27% for E. coli and 53% for Enterococcus at this site.
3 out of 4

Three of the four criteria exceed the threshold values this week at Las Virgenes Creek at the bridge. The single sample E. coli value was below the threshold of 235 MPN/100ml but the geometric mean value for E. coli was over the threshold of 126 MPN/100ml.The single sample Enterococcus value was over the threshold of 110 MPN/100ml and the geometric mean value for Enterococcus was over the threshold of 30 MPN/100ml. Since June 15, 2016, we have documented exceedance rates (for single samples) of 29% for E. coli and 57% for Enterococcus at this site.
2 out of 4

Two of the four criteria exceed the threshold values this week at Las Virgenes Creek at the bridge. The single sample E. coli value was below the threshold of 235 MPN/100ml but the geometric mean value for E. coli was over the threshold of 126 MPN/100ml.The single sample Enterococcus value was below the threshold of 110 MPN/100ml but the geometric mean value for Enterococcus was over the threshold of 30 MPN/100ml. Since June 15, 2016, we have documented exceedance rates (for single samples) of 31% for E. coli and 54% for Enterococcus at this site.
2 out of 4

Two of the four criteria exceed the threshold values this week at Las Virgenes Creek at the bridge. The single sample E. coli value was below the threshold of 235 MPN/100ml but the geometric mean value for E. coli was over the threshold of 126 MPN/100ml.The single sample Enterococcus value was below the threshold of 110 MPN/100ml but the geometric mean value for Enterococcus was over the threshold of 30 MPN/100ml. Since June 15, 2016, we have documented exceedance rates (for single samples) of 33% for E. coli and 58% for Enterococcus at this site.
3 out of 4

Three of the four criteria exceed the threshold values this week at Las Virgenes Creek at the bridge. The single sample and geometric mean values for E. coli value were both over their respective thresholds of 235 MPN/100ml and 126 MPN/100ml. The single sample Enterococcus value was below the threshold of 110 MPN/100ml but the geometric mean value for Enterococcus was over the threshold of 30 MPN/100ml. Since June 15, 2016, we have documented exceedance rates (for single samples) of 36% for E. coli and 64% for Enterococcus at this site.
3 out of 4

Three of the four criteria exceed the threshold values this week at Las Virgenes Creek at the bridge. The single sample E. coli value was below the threshold of 235 MPN/100ml, while the geometric mean for E. coli was over 126 MPN/100ml. Both the single sample and geometric mean values for Enterococcus were over their respective thresholds. Since June 15, 2016, we have documented exceedance rates (for single samples) of 30% for E. coli and 70% for Enterococcus at this site.
4 out of 4

Four of the four criteria exceed the threshold values this week at Las Virgenes Creek at the bridge. The single sample E. coli value was above the threshold of 235 MPN/100ml, and the geometric mean for E. coli was over 126 MPN/100ml. Similarly, both the single sample and geometric mean values for Enterococcus were over their respective thresholds. Since June 15, 2016, we have documented exceedance rates (for single samples) of 33% for E. coli and 67% for Enterococcus at this site.
3 out of 4

Three of the four criteria exceed the threshold values this week at Las Virgenes Creek at the bridge. The single sample E. coli value was below the threshold of 235 MPN/100ml but the geometric mean for E. coli was over 126 MPN/100ml, and both the single sample and geometric mean values for Enterococcus were over their respective thresholds. Since June 15, 2016, we have documented exceedance rates (for single samples) of 25% for E. coli and 62% for Enterococcus at this site.
3 out of 4

Three of the four criteria exceed the threshold values this week at Las Virgenes Creek at the bridge. The single sample E. coli value was below the threshold of 235 MPN/100ml but the geometric mean for E. coli was over 126 MPN/100ml, and both the single sample and geometric mean values for Enterococcus were over their respective thresholds. Since June 15, 2016, we have documented exceedance rates (for single samples) of 29% for E. coli and 57% for Enterococcus at this site.
Los Angeles River – Number of Exceedances
Site Name9/27/169/20/169/13/169/6/168/30/168/23/16
Steelhead Park, Elysian Valley1 out of 4

Only one of the four criteria exceeds the threshold values this week at the Steelhead Park site for the Los Angeles River. The single sample E. coli value was below the threshold of 235 MPN/100ml, and the geometric mean for E. coli was below 126 MPN/100ml. The single sample Enterococcus value was also below the threshold of 110 MPN/100ml but the geometric mean value for Enterococcus was over the threshold of 30 MPN/100ml. Since May 31, 2016, we have documented exceedance rates (for single samples) of 6% for E. coli and 61% for Enterococcus at this site.
1 out of 4

Only one of the four criteria exceeds the threshold values this week at the Steelhead Park site for the Los Angeles River. The single sample E. coli value was below the threshold of 235 MPN/100ml, and the geometric mean for E. coli was below 126 MPN/100ml. The single sample Enterococcus value was also below the threshold of 110 MPN/100ml but the geometric mean value for Enterococcus was over the threshold of 30 MPN/100ml. Since May 31, 2016, we have documented exceedance rates (for single samples) of 6% for E. coli and 65% for Enterococcus at this site.
1 out of 4

Only one of the four criteria exceeds the threshold values this week at the Steelhead Park site for the Los Angeles River. The single sample E. coli value was below the threshold of 235 MPN/100ml, and the geometric mean for E. coli was below 126 MPN/100ml. The single sample Enterococcus value was also below the threshold of 110 MPN/100ml but the geometric mean value for Enterococcus was over the threshold of 30 MPN/100ml. Since May 31, 2016, we have documented exceedance rates (for single samples) of 6% for E. coli and 69% for Enterococcus at this site.
1 out of 4

Only one of the four criteria exceeds the threshold values this week at the Steelhead Park site for the Los Angeles River. The single sample E. coli value was below the threshold of 235 MPN/100ml, and the geometric mean for E. coli was below 126 MPN/100ml. The single sample Enterococcus value was also below the threshold of 110 MPN/100ml but the geometric mean value for Enterococcus was over the threshold of 30 MPN/100ml. Since May 31, 2016, we have documented exceedance rates (for single samples) of 7% for E. coli and 73% for Enterococcus at this site.
2 out of 4

Two of the four criteria exceed the threshold values this week at the Steelhead Park site for the Los Angeles River. The single sample E. coli value was below the threshold of 235 MPN/100ml, and the geometric mean for E. coli was below 126 MPN/100ml. In contrast, both the single sample and geometric mean values for Enterococcus were over their respective thresholds (110 and 30 MPN/100ml). Since May 31, 2016, we have documented exceedance rates (for single samples) of 7% for E. coli and 79% for Enterococcus at this site.
2 out of 4

Two of the four criteria exceed the threshold values this week at the Steelhead Park site for the Los Angeles River. The single sample E. coli value was below the threshold of 235 MPN/100ml, and the geometric mean for E. coli was below 126 MPN/100ml. In contrast, both the single sample and geometric mean values for Enterococcus were over their respective thresholds. Since May 31, 2016, we have documented exceedance rates (for single samples) of 8% for E. coli and 77% for Enterococcus at this site.
Rattlesnake Park, Elysian Valley3 out of 4

Three of the four criteria exceed the threshold values this week at the Rattlesnake Park site for the Los Angeles River. The single sample value for E. coli was below the threshold of 235 MPN/100ml, but the geometric mean for E. coli was over the threshold of 126 MPN/100ml. Both the single sample and geometric mean values for Enterococcus were also over their respective thresholds (110 and 30 MPN/100ml). Since May 31, 2016, we have documented exceedance rates (for single samples) of 50% for E. coli and 100% for Enterococcus at this site.
4 out of 4

All four of the criteria exceed the threshold values this week at the Rattlesnake Park site for the Los Angeles River. The single sample and geometric mean values for E. coli value were above the thresholds of 235 and 126 MPN/100ml, respectively. Both the single sample and geometric mean values for Enterococcus were also over their respective thresholds (110 and 30 MPN/100ml). Since May 31, 2016, we have documented exceedance rates (for single samples) of 53% for E. coli and 100% for Enterococcus at this site.
4 out of 4

All four of the criteria exceed the threshold values this week at the Rattlesnake Park site for the Los Angeles River. The single sample and geometric mean values for E. coli value were above the thresholds of 235 and 126 MPN/100ml, respectively. Both the single sample and geometric mean values for Enterococcus were also over their respective thresholds (110 and 30 MPN/100ml). Since May 31, 2016, we have documented exceedance rates (for single samples) of 50% for E. coli and 100% for Enterococcus at this site.
3 out of 4

Three of the four criteria exceed the threshold values this week at the Rattlesnake Park site for the Los Angeles River. The single sample E. coli value was below the threshold of 235 MPN/100ml, but the geometric mean for E. coli was over 126 MPN/100ml. Both the single sample and geometric mean values for Enterococcus were over their respective thresholds (110 and 30 MPN/100ml). Since May 31, 2016, we have documented exceedance rates (for single samples) of 47% for E. coli and 100% for Enterococcus at this site.
3 out of 4

Three of the four criteria exceed the threshold values this week at the Rattlesnake Park site for the Los Angeles River. The single sample E. coli value was below the threshold of 235 MPN/100ml, but the geometric mean for E. coli was over 126 MPN/100ml. Both the single sample and geometric mean values for Enterococcus were over their respective thresholds (110 and 30 MPN/100ml). Since May 31, 2016, we have documented exceedance rates (for single samples) of 50% for E. coli and 100% for Enterococcus at this site.
4 out of 4

Four of the four criteria exceed the threshold values this week at the Rattlesnake Park site for the Los Angeles River. The single sample E. coli value was above the threshold of 235 MPN/100ml, and the geometric mean for E. coli was over 126 MPN/100ml. Similarly, both the single sample and geometric mean values for Enterococcus were over their respective thresholds. Since May 31, 2016, we have documented exceedance rates (for single samples) of 54% for E. coli and 100% for Enterococcus at this site.
Sepulveda Basin at Burbank Blvd.1 out of 4

Only one of the four criteria exceeds the threshold values this week at the Sepulveda Basin site for the Los Angeles River. The single sample E. coli value was below the threshold of 235 MPN/100ml, and the geometric mean for E. coli was below 126 MPN/100ml. The single sample Enterococcus value was also below the threshold of 110 MPN/100ml but the geometric mean value for Enterococcus was over the threshold of 30 MPN/100ml. Since May 31, 2016, we have documented exceedance rates (for single samples) of 0% for E. coli and 6% for Enterococcus at this site.
1 out of 4

Only one of the four criteria exceeds the threshold values this week at the Sepulveda Basin site for the Los Angeles River. The single sample E. coli value was below the threshold of 235 MPN/100ml, and the geometric mean for E. coli was below 126 MPN/100ml. The single sample Enterococcus value was also below the threshold of 110 MPN/100ml but the geometric mean value for Enterococcus was over the threshold of 30 MPN/100ml. Since May 31, 2016, we have documented exceedance rates (for single samples) of 0% for E. coli and 7% for Enterococcus at this site.
2 out of 4

Two of the four criteria exceed the threshold values this week at the Sepulveda Basin site for the Los Angeles River. The single sample E. coli value was below the threshold of 235 MPN/100ml, and the geometric mean for E. coli was below 126 MPN/100ml. In contrast, both the single sample and geometric mean values for Enterococcus were over their respective thresholds. Since May 31, 2016, we have documented exceedance rates (for single samples) of 0% for E. coli and 8% for Enterococcus at this site.

We envision safe swimmable rivers and creeks throughout Los Angeles County. However, a number of recreational waterbodies are not regularly monitored or monitored at all. We know thousands of Angelenos use these aquatic resources.

As such, Heal the Bay would rather provide some information about the water quality they are immersing themselves into rather than no information. The idea is to prompt the user to ask questions about these waterbodies: What is the origin of the water? Can I get sick from it? What types of illnesses can I get? How do I get more information? Check out the answers to these questions and more in our FAQ and the joint statement on recreation in the L.A. River.

Malibu Creek State Park testing sites mapL.A. River testing sites map

Heal the Bay has been monitoring water quality in streams and rivers since 1998 through our Stream Team program. In 2014 we initiated a pilot study to monitor human use and water quality at freshwater swimming spots in the Santa Monica Mountains, focusing on bacterial pollution and public health implications. We are currently in our third summer of monitoring water quality in those swimming locations. Given Heal the Bay’s 25-year history of informing and educating beachgoers about beach water quality through our Beach Report Card, assessing the water quality of the Los Angeles River recreation zones was a natural next step. We are now in our second season of monitoring for the L.A. River recreation zones.

The A-to-F grading system of the Beach Report Card took years of work to develop and fine-tune. We are only in the very early stages of thinking about an analogous River Report Card. But we want to start by making basic water quality information available to the public in a timely manner.

We will be providing weekly information about levels of fecal indicator bacteria at five sites. We will report on whether the sample from the current week exceeded limits set by the Regional Water Quality Control Board and US EPA and what the microbial water quality has been over the summer sampling season thus far.

We will report on two types of fecal indicator bacteria, or FIB: E. coli and Enterococcus. FIB, while not harmful themselves, indicate the possible presence of pathogenic bacteria, which have been found to cause ear infections, skin rashes, respiratory illnesses and gastrointestinal illness. High levels of FIB are particularly concerning in areas where people come in contact with water through activities like swimming, fishing, and kayaking.

Excuse us for getting technical in this next section, but we just want to be clear about what we are measuring and what constitutes an exceedance.

We compare bacteria levels measured at each site to water quality objectives from the Total Maximum Daily Loads (TMDL) for Bacteria in the Malibu Creek Watershed and the Los Angeles River Watershed as well as EPA’s 2012 Recreational Water Quality Criteria (RWQC)

The freshwater regulatory limit for E. coli is set in the TMDL at 235 MPN/100ml for a single sample and 126 MPN/100ml for the geometric mean. (A geometric mean is a type of average that results in a number that is not as heavily affected by very high or very low values).

We calculate geometric means from all samples over the last 30-day period (usually four or five samples). For Enterococcus, we used EPA’s statistical threshold value for an illness rate of 32/1,000 (the more protective rate), which is 110 MPN/100ml for a single sample and 30 MPN/100ml for the geometric mean in a fresh waterbody designated for recreation.

For each site, we will report on the number of criteria that exceeded four standards. A site can have 0-4 out of four exceedances. A sample exceeds if:

  • E. coli single sample > 235 MPN/100ml
  • E. coli geometric mean > 126 MPN/100ml
  • Enterococcus single sample is > 110 MPN/100ml
  • Enterococcus geometric mean is > 30 MPN/100ml

So, what does that all mean?

The greater the number and magnitude of exceedances at a site, the worse the water quality is, indicating a potentially increased risk of getting sick.

Deciding what to do with this information depends on the risk level you are comfortable with. Single sample values give you an indication of the most recent water quality, while geometric mean values give you an indication of the ambient water quality over the last 30 days.

However, it is important to note that the single sample gives information for the day on which the sample was taken and conditions can change throughout the week until the next sample is taken.

The thresholds that the US EPA and the RWQCB have put forth are based on epidemiological studies and risk. An increased risk of illness is not a guarantee that you will get sick. Certain activities are more risky when water quality is poor; for instance, swimming and submerging your head is more risky than wading; swimming is more risky than kayaking; kayaking is likely more risky than hiking (at least with regards to picking up a waterborne illness), and so on, with the risk dependent on how likely you are to ingest or contact water.

We recommend following these best practices to stay safe and healthy.

  • Swimming: In waters known to exceed bacterial limits, swimming is not recommended, particularly submerging one’s head. Elevated bacteria levels can occur at any time. Swimmers should use caution when entering the water by checking the latest water quality results, avoiding contact immediately after a rainfall, if they are immunocompromised, or if they have an open wound. If there is any water contact, then rise off with soap and water afterward.
  • Kayaking and Fishing: In waters that are known to exceed bacterial limits, people should limit water contact, especially avoiding hand-to-face water contact. Users should not enter the water with an open wound, if immunocompromised, or after a rainfall. If there is any water contact, then rinse off with soap and water afterward.


Aug, 5, 2016 — Staff scientist Katherine Pease launches our Freshwater Friday blog post, providing weekly updates on the latest bacterial exceedances at popular recreational zones

Heal the Bay’s inaugural study of Los Angeles River microbial water quality that we published last week and last year’s study on swimming holes in the Santa Monica Mountains called for more readily available public water quality information. The public has a right to know about water quality conditions in these freshwater recreation areas so that they can make informed decisions on how to minimize the risk of getting sick.

So beginning today with our Santa Monica Mountains sites, we will be posting a blog post every Friday during the summer with water quality information from our weekly sampling of freshwater recreation sites in Los Angeles County. (You can see this week’s findings at the bottom of this page, but first we want to explain our intent and methodology.)

We envision safe swimmable rivers and creeks throughout Los Angeles County. However, a number of recreational waterbodies are not regularly monitored or monitored at all. We know thousands of Angelenos use these aquatic resources.

As such, Heal the Bay would rather provide some information about the water quality they are immersing themselves into rather than no information. The idea is to prompt the user to ask questions about these waterbodies: What is the origin of the water? Can I get sick from it? What types of illnesses can I get? How do I get more information? We will be posting a Frequently Asked Questions document next week to help answer some of these questions.

Heal the Bay has been monitoring water quality in streams and rivers since 1998 through our Stream Team program. In 2014 we initiated a pilot study to monitor human use and water quality at freshwater swimming spots in the Santa Monica Mountains, focusing on bacterial pollution and public health implications.

The A-to-F grading system of the Beach Report Card took years of work to develop and fine-tune. We are only in the very early stages of thinking about an analogous River Report Card. But we want to start by making basic water quality information available to the public in a timely manner.

We will be providing weekly information about levels of fecal indicator bacteria at five sites. We will report on whether the sample from the current week exceeded limits set by the Regional Water Quality Control Board and US EPA and what the microbial water quality has been over the summer sampling season thus far.

We will report on two types of fecal indicator bacteria, or FIB: E. coli and Enterococcus. FIB, while not harmful themselves, indicate the possible presence of pathogenic bacteria, which have been found to cause ear infections, skin rashes, respiratory illnesses and gastrointestinal illness. High levels of FIB are particularly concerning in areas where people come in contact with water through activities like swimming, fishing, and kayaking.

Excuse us for getting technical in this next section, but we just want to be clear about what we are measuring and what constitutes an exceedance.

We compare bacteria levels measured at each site to water quality objectives from the Total Maximum Daily Loads (TMDL) for Bacteria in the Malibu Creek Watershed and EPA’s 2012 Recreational Water Quality Criteria (RWQC)

The freshwater regulatory limit for E. coli is set in the TMDL at 235 MPN/100ml for a single sample and 126 MPN/100ml for the geometric mean. (A geometric mean is a type of average that results in a number that is not as heavily affected by very high or very low values).

We calculate geometric means from all samples over the last 30-day period (usually four or five samples). For Enterococcus, we used EPA’s statistical threshold value (for an illness rate of 32/1,000 (the more protective rate), which is 110 MPN/100ml for a single sample and 30 MPN/100ml for the geometric mean in a fresh waterbody designated for recreation.

For each site, we will report on the number of criteria that exceeded four standards. A site can have 0-4 out of four exceedances. A sample exceeds if:

E. coli single sample > 235 MPN/100ml 

E. coli geometric mean > 126 MPN/100ml

Enterococcus single sample is > 110 MPN/100ml

Enterococcus geometric mean is > 30 MPN/100ml

So, what does that all mean?

The greater the number and magnitude of exceedances at a site, the worse the water quality is, indicating a potentially increased risk of getting sick.

Deciding what to do with this information depends on the risk level you are comfortable with. Single sample values give you an indication of the most recent water quality, while geometric mean values give you an indication of the ambient water quality over the last 30 days.

However, it is important to note that the single sample gives information for the day on which the sample was taken and conditions can change throughout the week until the next sample is taken.

The thresholds that the US EPA and the RWQCB have put forth are based on epidemiological studies and risk. An increased risk of illness is not a guarantee that you will get sick. Certain activities are more risky when water quality is poor; for instance, swimming and submerging your head is more risky than wading; swimming is more risky than kayaking; kayaking is likely more risky than hiking (at least with regards to picking up a waterborne illness), and so on, with the risk dependent on how likely you are to ingest or contact water.

We recommend following these best practices to stay safe and healthy.

  • Swimming: In waters known to exceed bacterial limits, swimming is not recommended, particularly submerging one’s head. Elevated bacteria levels can occur at any time. Swimmers should use caution when entering the water by checking the latest water quality results, avoiding contact immediately after a rainfall, if they are immunocompromised, or if they have an open wound. If there is any water contact, then rise off with soap and water afterward.
  • Kayaking and Fishing: In waters that are known to exceed bacterial limits, people should limit water contact, especially avoiding hand-to-face water contact. Users should not enter the water with an open wound, if immunocompromised, or after a rainfall. If there is any water contact, then rinse off with soap and water afterward.

Malibu Creek State Park

for the week ending August 3, 2016

1. Rock Pool: Three exceedances

Three of the four criteria exceed the threshold values this week at Rock Pool site in Malibu Creek. For E. coli, the single sample and geometric mean values were over threshold values; the single sample Enterococcus value was under the threshold of 110 MPN/100ml but the geometric mean value was over the threshold value. Since June 15, 2016, we have documented exceedance rates (for single samples) of 43% for E. coli and 14% for Enterococcus at this site.

2. Las Virgenes Creek at the bridge: Three exceedances

Three of the four criteria exceed the threshold values this week at Las Virgenes Creek at the bridge. The single sample E. coli value was below the threshold of 235 MPN/100ml but the geometric mean for E. coli was over 126 MPN/100ml, and both the single sample and geometric mean values for Enterococcus were over their respective thresholds. Since June 15, 2016, we have documented exceedance rates (for single samples) of 29% for E. coli and 57% for Enterococcus at this site.


June 29, 2016 — Heal the Bay celebrates a concrete win in the decades-long fight to clean up polluted beaches in Malibu.

Malibu is one of the most breathtaking and desirable places to live in Southern California, but it has a dirty little secret – septic systems in and around its cultural center have fouled nearby coastal waters for decades.

Malibu Creek, Malibu Lagoon, and the surrounding ocean, including Surfrider Beach, are critically polluted and numerous studies point to septic systems as a major contributor. Swimmers who recreate in these waters run the risk of all kinds of illnesses.

But today Heal the Bay staff and members celebrated an important milestone in what has been a long and protracted fight to reduce water pollution in Malibu – groundbreaking on a Civic Wastewater Treatment Facility.

For more than 15 years, Heal the Bay has called for the Malibu Civic Center’s septic systems to be replaced by a centralized wastewater treatment facility. It has been a long and bumpy road, with officials complaining about costs and some residents worried about the specter of development if sewers are put in. But our advocacy is finally starting to yield tangible results.

The Los Angeles Regional Water Quality Control Board adopted a Septic Prohibition in 2009 that required the phasing out by 2019 of all septic systems in the Malibu Civic Center Area (think Malibu Pier, Pepperdine, Malibu Bluffs Park). And in 2015 the Malibu City Council unanimously certified the Civic Center Wastewater Treatment Facility Final Environmental Impact Report and later secured funding for the facility.

Malibu City Councilmembers, along with members of the California State and Regional Water Control Board, were all in attendance today to put golden shovel to dirt.

“The facility will enable Malibu to protect the natural environment that we cherish, while meeting state mandates to end the use of septic systems in the Civic Center area and producing recycled water to reduce Malibu’s reliance on potable water,” said Laura Rosenthal, Malibu’s current mayor.

Ground breaking at MalibuIt was especially gratifying to see Mark Gold, past Heal the Bay president and current board member, in attendance. Amid often fierce opposition from city officials and some Malibu property owners, Gold led the charge to demand an end to septic tanks in the Civic Center area for many years. He helped broker an MOU between the city and the regional water board that phased out septic tanks and mandated the building of a more modern treatment facility. (You can read more about his war wounds in one of his blog posts here.)

While today’s groundbreaking is a big step, the journey to better water quality is far from complete. Septic tanks are still in the process of being phased out and water quality in Malibu Creek, Malibu Lagoon, and local beaches isn’t likely to show improvement until the facility actually begins to treat local wastewater.

The wastewater treatment site is located at the intersection of Civic Center Way and Vista Pacifica. The facility will treat wastewater from properties in and around the Civic Center, and use the recycled water produced by the facility for irrigation of local parks and landscaping.

As the construction advances, we promise to remain vigilant and keep you updated.


Peter Shellenbarger, a Heal the Bay science and policy analyst, tries his hand at Hollywood with a hotly anticipated “soup opera.” As the Septics Seep is his artistic interpretation of the Malibu Civic Center Septic Saga, where Mrs. Water Quality and Mr. Civic Center navigate the sordid, stinky world of Malibu water politics.


As The Septics Seep

Any relationship has its ups and downs—especially one between a coastal city and its water quality.


The backstory

In 2006, Malibu Creek, Malibu Lagoon, Malibu Beach, Malibu Surfrider Beach and Carbon Beach (in the Malibu Civic Center area) were placed on the Clean Water Act’s list of impaired and threatened water bodies. Septic system discharges were identified as contributors to this impairment in 2009 and a Septic Prohibition was issued. In 2011, the City of Malibu agreed to build a centralized wastewater recycling facility to phase out septic systems in the Civic Center area. However, just this month, the Los Angeles Regional Water Quality Control Board approved an extension for the phase-out, giving commercial and residential properties 20 extra months and three years, respectively, to remove their septic systems. These extensions undermine the Septic Prohibition and will allow the City of Malibu to continue discharging septic system effluent into already critically polluted waterbodies. This month’s decision is another setback for water quality in Malibu and showcases the Regional Board’s historical inability to hold the City of Malibu accountable for their septic system discharges, which impact human health and aquatic life in and around Malibu Creek and Lagoon.


Cast (in order of appearance)

Sheriff U.S. E.P.A.: Tall, stern water quality enforcer
Mrs. Water Quality: Peppy environmental scientist
Mr. Civic Center: Distinguished landowner of Civic Center Area in Malibu
Officer L.A.W. (L.A. Regional Water Control Board): Overworked, tired water quality engineer


Season synopses

S1 Sheriff E.P.A. comes to town and nails Malibu Creek, Malibu Lagoon, Malibu Beach, Malibu Surfrider Beach and Carbon Beach for public intoxication. Loaded with bacteria and nutrients, she places these waters on the critically polluted list for further investigation and future cleanup. Mrs. Water Quality begins to investigate the cause of pollution…and catches the eye of Mr. Civic Center in the process.

S2 Mrs. Water Quality identifies septic systems as a source of bacteria and nutrient pollution at Mr. Civic Center’s residence. Officer L.A.W. assesses the situation, conducts further studies, consults with other officers and creates a Septic Prohibition at Mr. Civic Center’s residence. This will require him to phase out septic system discharges at his commercial and residential properties by November 5, 2015, and November 5, 2019, respectively.

S3 To implement the Septic Prohibition, Mr. Civic Center and Officer L.A.W. agree to build a centralized wastewater recycling facility to replace septic systems polluting Malibu’s coastal waters. Mrs. Water Quality is sufficiently impressed by Mr. Civic Center’s commitment to the environment and finally agrees to date him.

S4 Mrs. Water Quality and Mr. Civic Center are seen publicly all over the Westside, and soon move in together and begin planning their romantic wastewater recycling facility hideaway. But Mr. Civic Center reveals himself to be all talk, delaying construction of the project by 9 to 12 months. He assures Mrs. Water Quality it will be completed before November 5, 2015. Mrs. Water Quality has heard that one before.

S5 Mr. Civic Center and Officer L.A.W. arrange to extend the commercial septic phase-out deadline by 20 months—and the residential phase out deadline by 3 years. Officer L.A.W. approves the extension despite a lack of public support and passionate opposition from Mrs. Water Quality—who feels betrayed by both Mr. Civic Center and Officer L.A.W. Mrs. Water Quality moves out of Mr. Civic Center’s residence.

What will happen to this tragic duo in S6? Will they patch up their differences or has their love truly tanked? One thing is certain: In addition to being a heartbreaker, Mr. Civic Center will continue to harm human health and aquatic life with his septic obsession.

TO BE CONTINUED NEXT SEASON…

As the Septics Seep: A Malibu Soup Opera


Just in time for the last hurrah of summer, beachgoers on the West Coast can head to the shore this Labor Day secure that they’ll be swimming and playing in healthy water.  According to the 2013 End of Summer Beach Report Card®, beach water quality in California, Oregon and Washington was excellent for the fourth consecutive summer.

We collected water quality data at more than 640 monitoring locations along the West Coast between Memorial Day and Aug. 21, 2013. Then we assigned an A-to-F grade based on bacterial pollution levels. Nearly 96% of California beaches earned an A or B grade. Washington earned A or B grades at 91% of its beaches, and Oregon earned all A grades for the fourth consecutive year. 

To find out which beaches didn’t make the grade and how your county stacks up, consult our 2013 End of Summer Beach Report Card®:

Beachgoers can find out which beaches are safe, check recent water quality history and look up details on beach closures using our Beach Report Card. On the go? Download a free Beach Report Card mobile app for iPhone or Android.


The Beach Report Card Summer Shades Contest

APP UPDATE: We are currently experiencing some issues with the Beach Report Card App due to opperating system changes. In the meantime, please go directly to beachreportcard.org for all your healthy beach reporting needs!

Is the water quality at your favorite California beach shady? Find out in the Beach Report Card (BRC) Summer Shades Contest! Watch the water quality at your favorite beach and you could win an exclusive pair of Heal the Bay shades.


We’re giving away ten pairs of our limited edition “I Heal the Bay” sunglasses over the next ten days. Every day, starting Tuesday August 6th, we will pick a winner and announce them on Facebook, Twitter and Instagram. To win a pair of shades, be the first to answer the daily trivia question found on our Facebook page.

To enter, download the Beach Report Card mobile app and leave your answer as a comment in the feedback tab including the hashtag #SummerShades.

Here’s How To Leave Feedback on the Beach Report Card App:

How-To Leave Feedback on the Beach Report Card App


Amy Smart sporting Heal the Bay sunglasses at Bring Back the Beach


In honor of the first Swimmable California Day, a few of us at Heal the Bay felt inspired to share our favorite beaches for swimming, surfing and kayaking because today we celebrate California’s healthy waters and the legislation we’ve enacted to protect them. Now go get in the ocean!

Bay Street, Tower 20

Bay Street is my go-to surf spot. It’s close to the Heal the Bay office, so I can get a quick morning surf session in before heading to work. Several Heal the Bay staffers call this break home, making it a great place to meet up and surf with friends. The waves aren’t the best in the bay, but I always have a blast when I’m out there in the water. It’s a good place to learn how to surf by riding the white wash, and the waves can get pretty gnarly and powerful so it teaches you how to navigate strong surf. It’s where I learned how to surf, and I’ll never forget the first time I made the drop on what was a HUGE wave for me – average for anyone else – and got totally stoked. Another thing I love about Bay Street is the historical significance it holds as the home break of Nick Gabaldon, a barrier breaker in the history of surfing. When I’m out in the water I imagine Nick putting his longboard in the water and starting his 12 mile journey north, paddling to ride the epic waves at Surfrider in Malibu (see below). You can find me out there practicing most mornings, working on my own journey, hoping someday to be good enough to surf alongside Sarah and other surfing greats at Surfrider! 🙂

 —  Ana Luisa Ahern, Interactive Campaigns Manager

Catalina Island

Slicing through the emerald green saltwater with my kayak paddle, I enjoy the expansive view of Catalina’s craggy island coastline. If I look closely, I might spot a grazing bison on the hills or a soaring bald eagle searching for fish. I beach my kayak along the narrow isthmus beach and head up towards the small SCUBA shop to check if my tanks are filled from this morning’s dives. I treasure my summer weeks at Catalina Island, diving right off our sailboat to be submerged within an underwater world filled with garibaldis, bat rays, and giant kelpfish. No sounds of cars, crowds, or sirens – just the ocean breathing, people laughing, and boats cutting through the water. Catalina Island’s isthmus is my favorite swimmable beach, and my little ocean paradise.

– Dana Roeber Murray, Marine and Coastal Scientist

Malibu

Some people seem a little shocked when they ask my favorite place to surf, and hear my response, “Malibu.” Malibu, Surfrider, 1st Point are all names for the long peeling right break just north of the Malibu Pier (pictured right). And, despite its water quality problems, it is my favorite wave, which I feel a little shame admitting as a scientist at Heal the Bay. During dry weather, Surfrider can score A’s on our Beach Report Card®, but during rainy weather or when Malibu Lagoon breaches, it’s not surprising to see it score F’s. Even with the crowds, I can’t get enough of the glassy long ride, whether it’s knee surf or overhead.

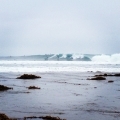
It’s too bad the questionable water quality haunts the minds of most surfers at Malibu, which is why California Swimmable Day is important – it reminds us that all beaches should be safe for swimming, and that clean-up efforts at dirty beaches need to be implemented to meet this goal. Sometimes it’s hard to stay out of the surf after a rain, especially with a nice storm swell, but the risk versus reward has to be weighed.

Some of my favorite spots near Malibu include: the veggie Farm Sandwich at John’s Garden, the refreshing smoothies at The Vitamin Barn, nighttime grunion runs on the beach during the spring and summer, catching a quiet sunrise over the Bay, spotting surfing dolphins (a rare but rewarding moment).

 –– Sarah Sikich

Science and Policy Director, Coastal Resources

Santa Monica Pier

I love summer time in SoCal for so many reasons.  One of my favorite reasons is the longer days.  More sun means more of a chance to swim before or after work.  One of my favorite spots to swim is to the south of the Santa Monica Pier, right near Tower 18 (the second tower south of the Pier).  It’s close enough for all the Pier amenities, and the long beach allows the waves to just roll in.  On a Thursday night, I can watch the opening act for the Twilight Concert Series as I body surf or boogie board.  With a backdrop of the sun setting behind the Santa Monica Mountains, those summer moments are hard to beat.     

— Tara Treiber, Education Director

Torrey Pines State Beach

Torrey Pines State Beach is my favorite beach to visit when I am in San Diego.  Torrey Pines offers everything you need to have a great beach day-good waves year round, beautiful natural environment, plentiful parking, and Mexican food within walking distance!  I love to surf and Torrey Pines always has waves.  I have been surfing here since I was a kid and whenever I am in San Diego, I try to surf Torrey Pines at least once because it reminds me of my childhood and I always seem to feel better off when I leave.

 —  Peter Shellenbarger, Science and Policy Analyst, Water Quality


On Saturday, July 27, 2013 LA Waterkeeper will host two events to celebrate! Bring your family for a fun day in the water!

Enter the California Coastalkeeper Alliance photo contest by uploading your favorite ocean action photos on Facebook, Twitter and Instagram with #SwimmableCA. CCKA will announce a grand prize winner on August 1, as well as top swimmable pet and youngster entries, and wettest photo.