
Por Matthew King | traducido por Beatriz Lorenzo | 25 enero 2017
La semana pasada el nuevo gobierno ordeno la congelación de los fondos para las becas y los contratos con la EPA. El director de comunicaciones Matthew King repasa cinco formas en las que esta directiva podría dañar la bahía.
Estos son tiempos revueltos y extraños en Washington D.C. Muchos conservadores y populistas están eufóricos con el nuevo gobierno, mientras que los progresistas cada día que pasa se sienten más pesimistas.
También nos podemos aventurar a decir que también son tiempos revueltos en nuestras oficinas a medida que vamos entendiendo y procesando lo que las acciones de la administración de Trump suponen para nuestro trabajo y para la bahía.
Como un perro guardián de confianza, Heal the Bay se guía por la mejor ciencia y no por las emociones. Y cuando una acción federal de la nueva administración amenaza la salud y el bienestar de la Bahía, hablamos bien claro.
Pues bien, éste es uno de esos momentos.
La semana pasada llegué al trabajo y nos enteramos de que la nueva administración había impuesto la congelación inmediata de todos los contratos y becas de la Agencia de Protección Ambiental de Estados Unidos (U.S. EPA). El alarmante procedimiento “amenaza con interrumpir operaciones tan importantes como las limpiezas de tóxicos o la monitorización de la calidad del agua”, según la investigación de ProPublica.
En total, la U.S. EPA reparte aproximadamente unos $6.4 billones en becas federales cada año para apoyar testeos, limpiezas e iniciativas para la recuperación, incluyendo varios de los programas de Heal the Bay.
Los funcionarios de la transición insisten en que es una mera pausa para permitir a los nuevos gerentes valorar si los programas deben continuar. Pero los empleados con más antigüedad y abogados especializados dan una imagen diferente – normalmente se congelan las contrataciones de empleados, pero no las becas, esto es inusual y amenaza con la interrupción de las contratas.
Según ProPublica, así respondió un contratante con la EPA a las preguntas de un empleado de una gestora de aguas pluviales: “ahora mismo estamos esperando. La nueva administración de la U.S. EPA ha pedido que todas las contratas y becas se suspendan temporalmente con efecto inmediato. Y hasta que recibamos clarificación del asunto, esto incluye tareas y asignación de proyectos.”
Hay muchas preguntas en el aire con esta suspensión, como cuanto durara y a que contratas impactara de modo más directo.
Como destinatarios de casi $200,000 anuales en formas de becas de la U.S. EPA estamos preocupados. De forma similar, muchas de las organizaciones con las que estamos asociados reciben fondos federales que impulsan iniciativas de colaboración con Heal The Bay.
Aún tenemos más preguntas que respuestas, pero vamos a ver el top 5 de los que se podrían ver afectados por la congelación de los fondos:
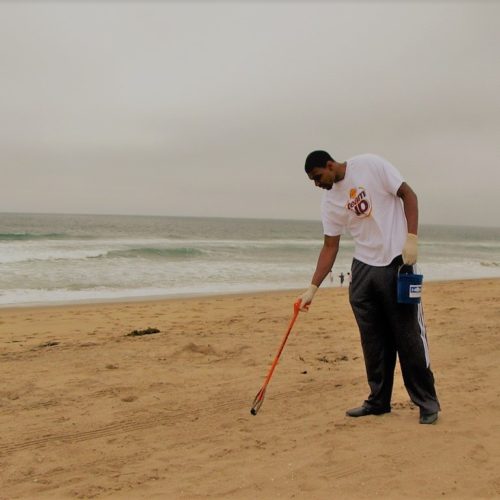
- Monitorización habitual de la calidad del agua de las playas
Nuestro Informe de Playas da una nota semanalmente de A a F a más de 500 playas en California, evitando que millones de personas que van a la playa se pongan enfermas. Los fondos de la U.S. EPA respaldan el testeo semanal del agua llevado a cabo por muchas agencias de salud condales por todo el estado. Sin dinero = no hay testeo = no hay datos = no hay informe de playas = puesta en peligro de la salud pública. En el pasado nos hemos enfrentado a problemas de este estilo cuando ha habido reducciones temporales del presupuesto, y hemos podido articular fondos poco a poco para poder seguir haciendo la monitorización. Pero ahora mismo, respecto a programas en las playas, no hay un plan del estado u otras instituciones financieras de recoger los pedazos que la EPA ha dejado.
- Mantener los ríos y arroyos locales sanos.
La salud de la bahía no se puede separar de la salud de las aguas que desembocan en ella. Arroyos, ríos y riachuelos fluyendo limpios traen consigo numerosos beneficios medioambientales, de hábitat, de mejor calidad del agua y de espacios de ocio. La U.S. EPA financia nuestro programa Stream Team pagando a los científicos empleados en la monitorización del agua y educación del público en lo referido al rio de Los Ángeles. Programas como el U.S. EPA’s Urban Waters Grant están especialmente diseñados para respaldar la restauración y protección de importantes vías de agua que fluyen por nuestras comunidades en los sitios en los que se necesita más un entorno natural al aire libre. La pérdida de programas como este es particularmente devastador para L.A.
-
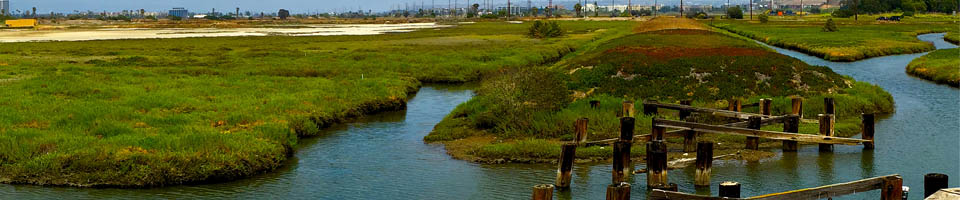
- Proteger nuestros menguantes humedales

L.A. ya ha perdido el 95% de sus lagunas costeras. Con el cambio climático y la urbanización invadiendo los pocos humedales que quedan, es crítico que actuemos ya para defender este hábitat natural. A través del National Estuary Program, la U.S. EPA trabaja para coordinar la protección y restauración de hábitats importantes en la bahía de Santa Mónica, como el Ballona Wetlands o las dunas costeras. Sarah Sikich, vicepresidenta de Heal the Bay’s, es también la vicepresidenta de la Junta Directiva de la Comisión de Restauración de la Bahía de Santa Mónica (Santa Monica Bay Restoration Commission Governing Board), el socio estatal del programa nacional de estuarios (National Estuary Program). Sin esta comisión, la protección y revitalización de los hábitats y de la calidad del agua en la Bahía de Santa Mónica quedaría seriamente incapacitada.
Son iniciativas esenciales para la salud a largo plazo de la bahía y en último caso, del sur de California. Congelar o reducir estos programas sería realmente imprudente.
-
-
- Deshacerse del DDT en la Bahía
-
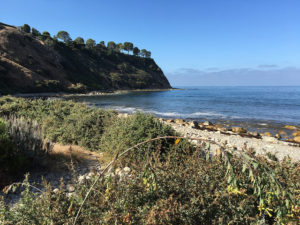
Mucha gente no se da cuenta de que la Bahía es lo que se llama un EPA Superfund site – que significa que somos uno de los lugares más peligrosamente contaminados de la nación. Un espacio de 180 acres de fondo marino cerca de Palos Verdes es el depósito más grande del mundo del pesticida DDT, un legado químico de los años 50 y 60.
El plan a largo plazo de la EPA de limpiar este desastre no debería quedarse en el limbo, ya que existe un acuerdo legal que requiere la limpieza de estos vertidos para proteger la vida animal y la salud pública.
-
-
- Prevenir el consumo de pescados locales contaminados
-
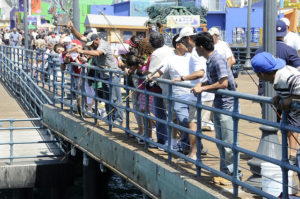
Gran cantidad de los peces pescados en la Bahía de Santa Mónica son aptos para el consumo. Pero algunas especies están contaminadas con niveles tóxicos de DDT, PCB y mercurio. Gracias a los fondos de la EPA, nuestro laureado equipo “Pier Angler Outreach” ha sondeado los sitios comunes de pesca local y ha advertido directamente a cerca de 150,000 personas sobre los peces aptos o no para consumo en una variedad de idiomas, desde tagalo a español. Por ser este un trabajo contratado requerido por un acuerdo legal, se encuentra en peligro por la congelación de fondos.
Por último, la congelación de fondos y contratas son parte de preocupaciones mayores. El nuevo gobierno ha empezado a avanzar amenazas reales para reducir programas de aguas limpias y regulaciones para proteger la salud pública; proteger hábitats como humedales y arroyos que amortiguan los impactos del cambio climático en comunidades y salvaguardan la fauna y otros logros importantes en materia de medioambiente.
Amordazando a sus agencias para que no comuniquen su importante labor y el estado real del medioambiente también es perjuicio enorme para el público, pues mantiene a los americanos en la ignorancia sobre importantes descubrimientos y sobre el estado de sus recursos naturales.
En los próximos días, prometemos compartir más información sobre los cambios de la U.S. EPA según los vayamos recibiendo. Y aun preocupados por las acciones de la semana pasada, seguimos en alerta por si se retira algunas de las regulaciones federales de las que se ha hablado que tuviese impacto en California. Si le preocupan estos problemas, es el momento de hacer oír su voz.
Contacte a su representante para pedirle la protección de estos programas tan importantes para el medioambiente. Pronto pondremos en marcha una alerta para que pueda pedir a los legisladores que mantengan los fondos de la EPA que más afectan a la Bahía en marcha. Permanezca a la escucha.
Según vamos haciendo la estrategia para la respuesta formal a la congelación de fondos, le animamos a hacer una donación para respaldar nuestro trabajo protegiendo la Bahía.

 Why are some grocery stores still offering plastic bags at the checkout?
  What does the law say about paper bags?
 How much can I be charged for a paper or reusable bag?
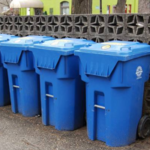 What should I do with all of the plastic bags I’ve saved under my kitchen sink?
 Our NowCast system uses statistical models to provide daily water quality information during the AB411 season. These models predict the concentration of bacteria in the water every morning, and are derived from years of water quality data and a whole lot of environmental variables that impact bacteria levels. NowCasting helps us answer what we don’t readily know – how much bacteria is likely in the water each morning, and thus if it is safe to swim – by looking at what we do know – what was the weather like yesterday, were there a lot of waves this morning stirring up the water, is the nearby river a’ flowing, etc. All of this data crunching and statistical hog-wrestling boils allows us to predict whether beach bacterial concentrations are likely to be safe or hazardous each morning.
 The first major finding of the season was expected: the drought continues to positively impact beach water quality. Think about it like this: less rain means less runoff which means less bacteria in the waves. And as Californians continue to conserve water, there is less dry-weather runoff from outdoor watering (nice work, by the way!). Every beach in the NowCast program (except at the Santa Monica Pier) recorded water samples that came back under sample limits (the levels of bacteria below which it is reasonably safe to swim), much cleaner than those beaches’ historical trends! This is great news for California beachgoers – they were able to enjoy cleaner than average conditions this summer at the NowCast beaches, something that we were able to inform them of on a daily basis.
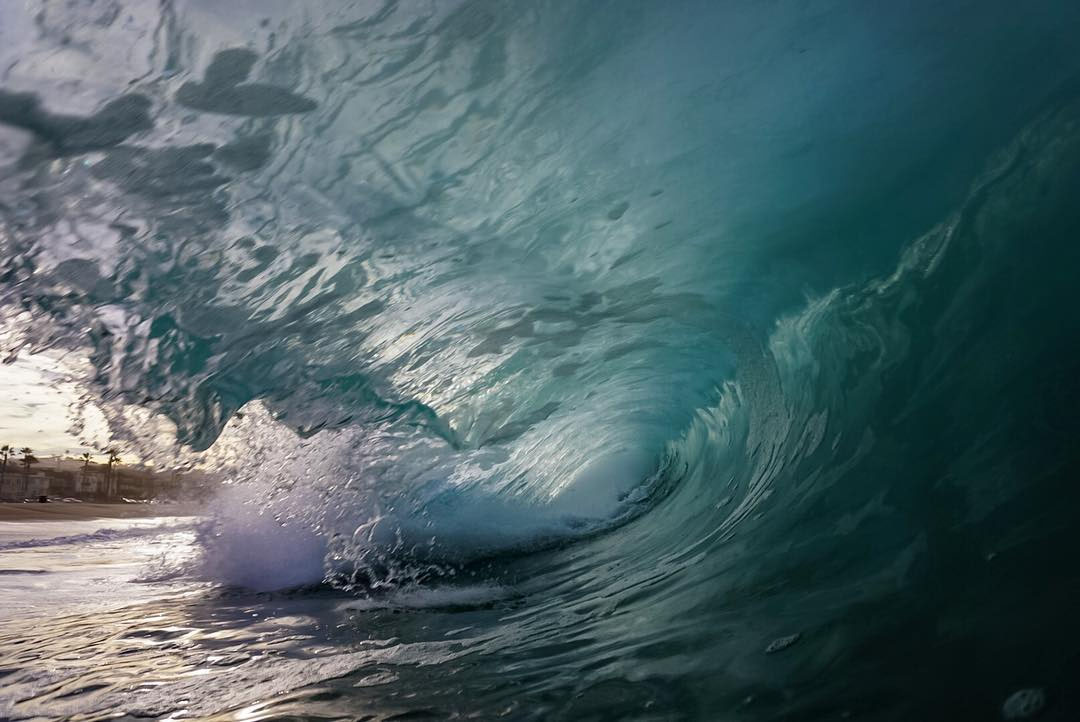
 That being said, we did have one site with more issues than the rest: Santa Monica Pier. The Pier has a chronic history of water quality problems. From 2008-2015, it experienced 28% and 10% exceedance rates for fecal coliform and Enterococcus standards respectively (two types of FIB) in the summer months. This season, it exceeded those FIB standards 41% and 10% of the time respectively, despite drought conditions. This suggests that water quality at Santa Monica Pier is especially affected by other factors in addition to rainfall. Because our models consider wave action, wind speed and direction, and tides, the fecal coliform model for Santa Monica Pier was able to predict 71% of actual exceedances, and 17% more exceedances than using days-old samples in the months of July, August, and September. This was the big result that gives us confidence in our models.
 Looking forward, we’re excited for the California NowCast program to enter its third year. We’ve got a whole bunch of good stuff up next on the menu. For the Summer 2017 season, we are looking to add up to eight new beaches to the program. NowCasting will eventually expand farther along the California coastline, creating a truly statewide program. Winter models at beaches with heavy year-round use are also on our radar (in case you surfers out there were wondering). We’re designing new NowCast beach signage to post on days where water quality is predicted to be poor. And keep an eye out for our groovy new Beach Report Card website and mobile app, an update launching in 2017 that will look and function better than ever, giving beachgoers up to date water quality information on the fly.