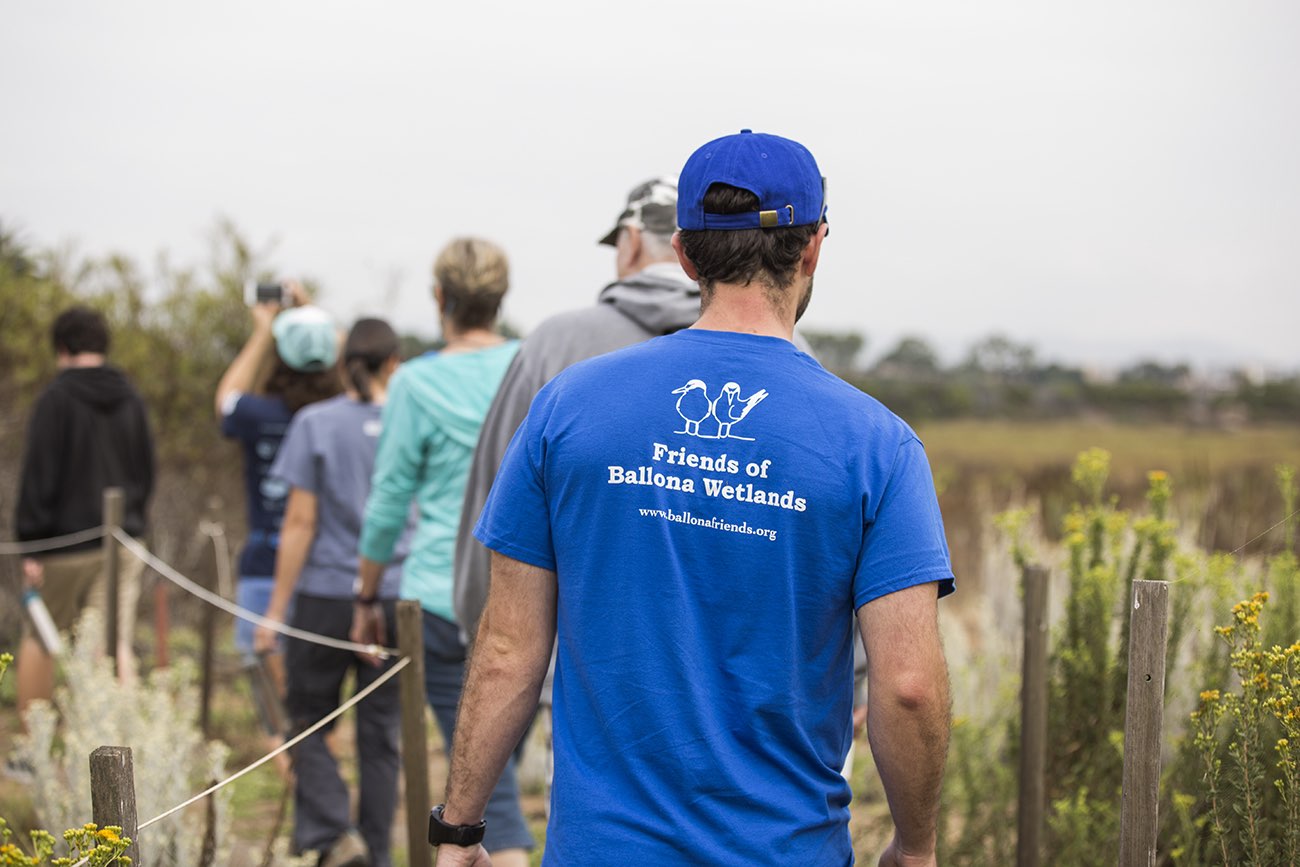
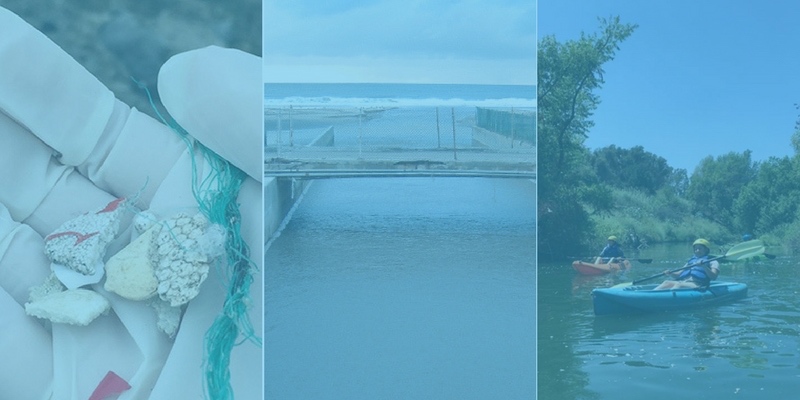
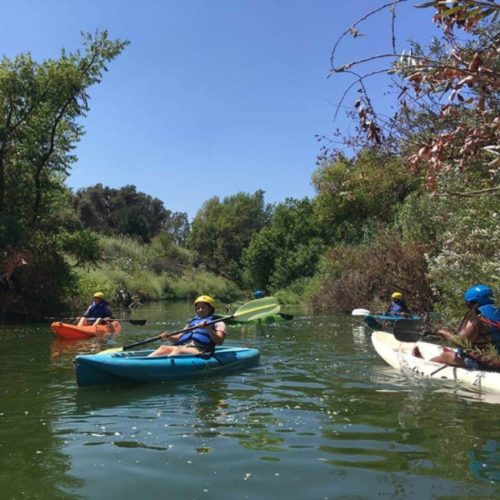
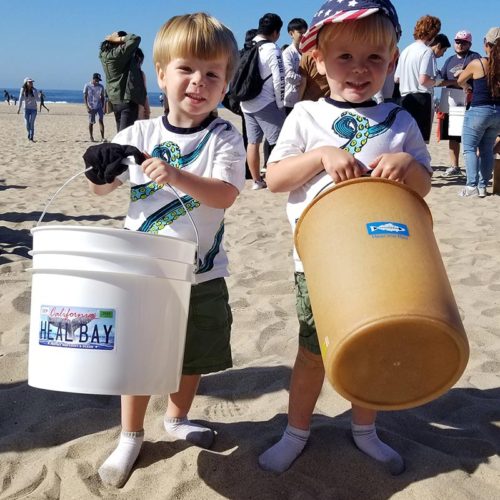
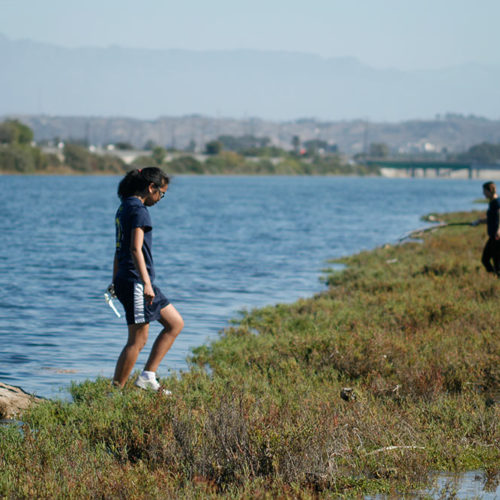
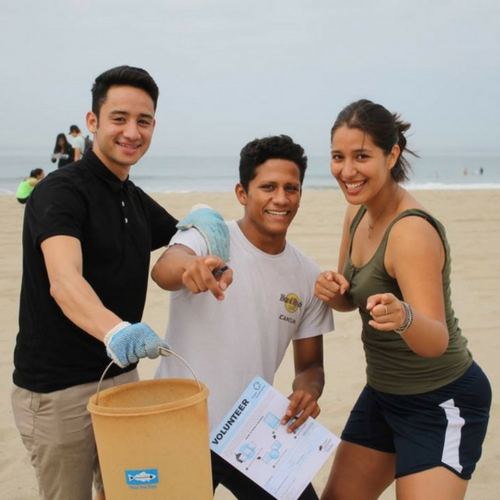
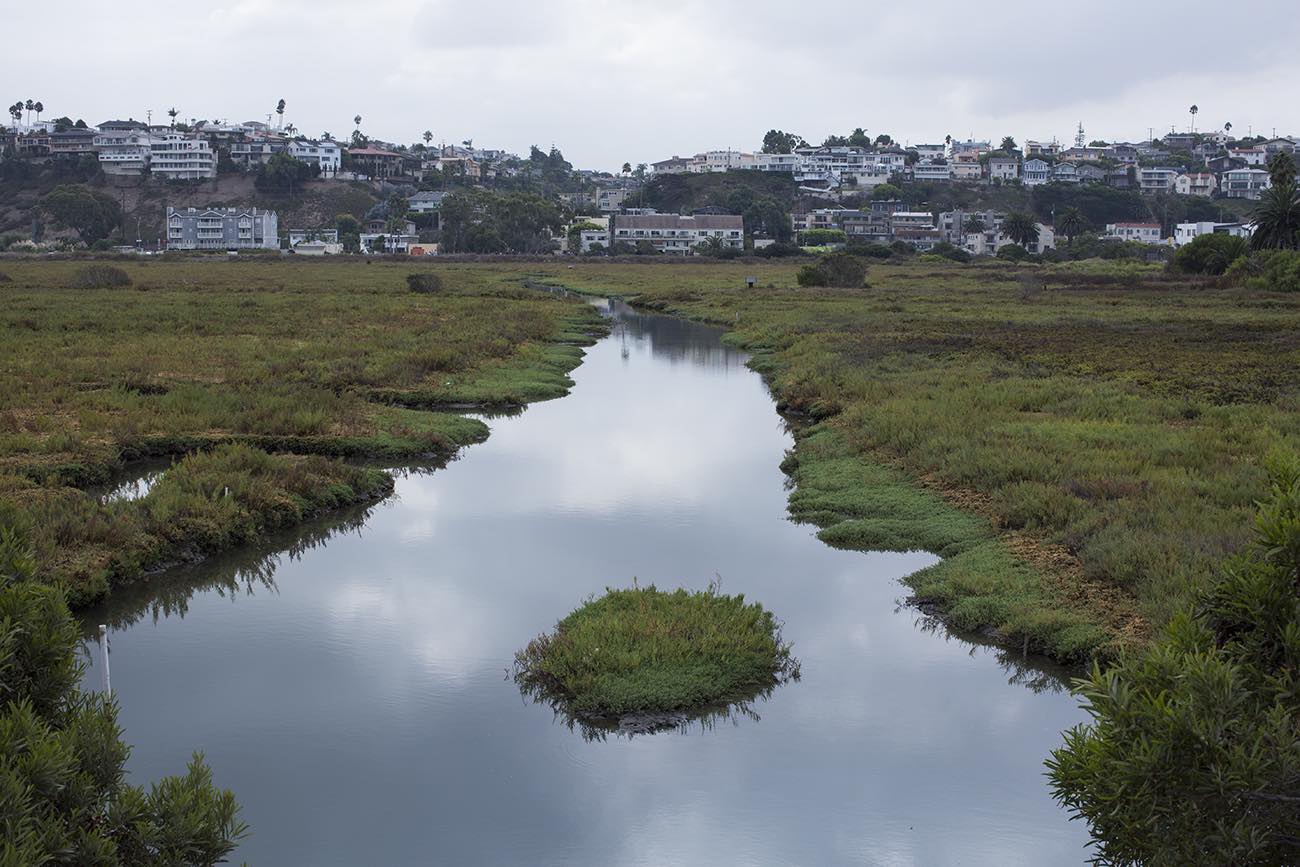
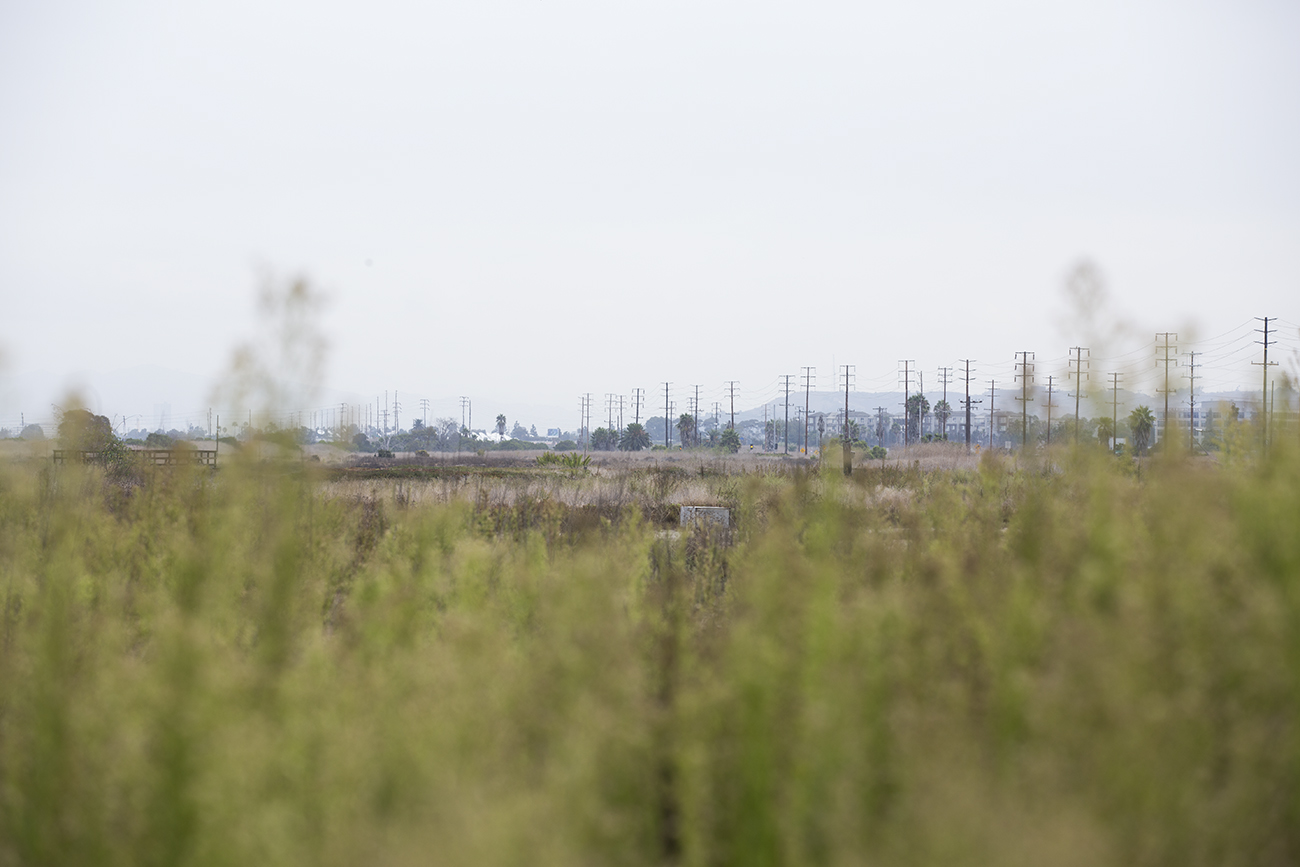
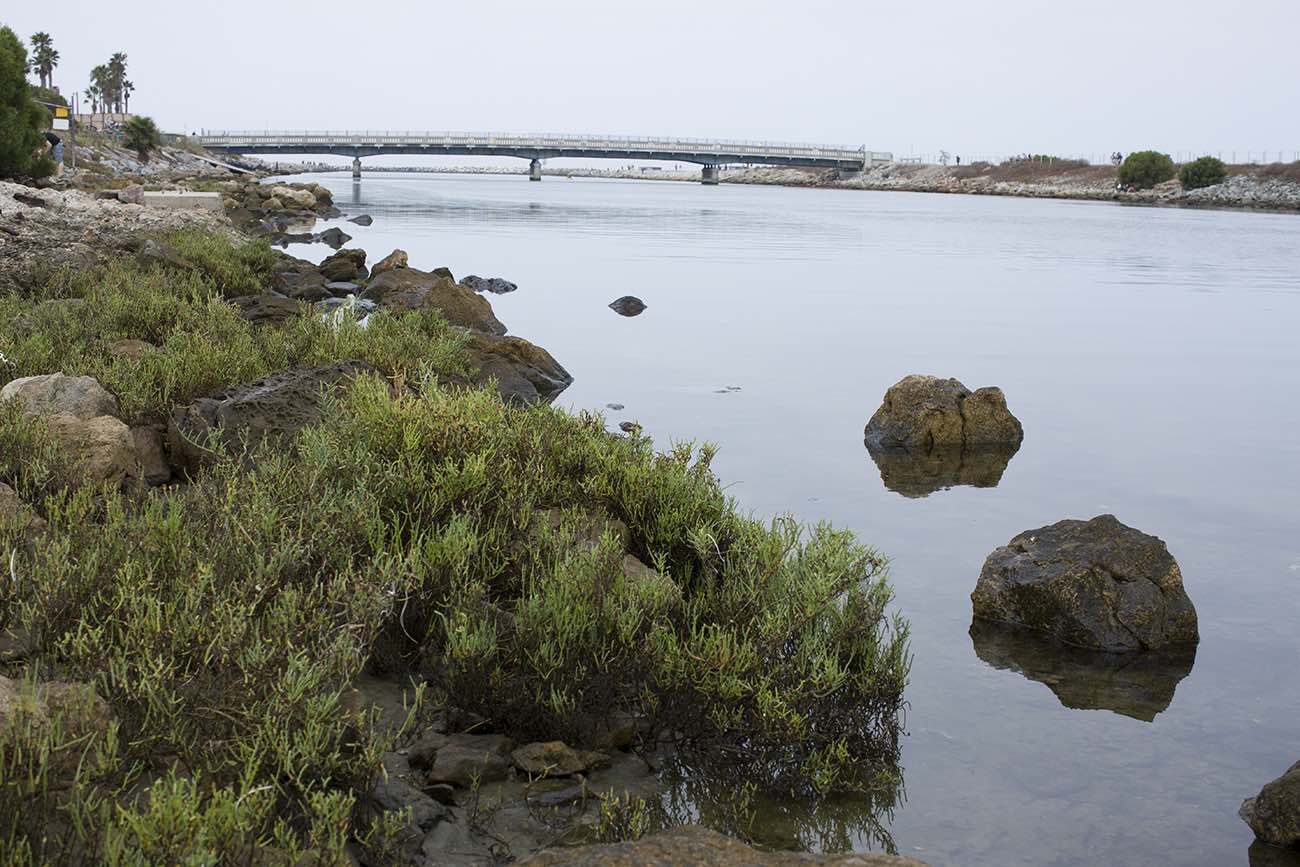
Photos of Ballona Wetlands on September 16, 2017 by Nicola Buck.
Excuse the pun, but today marks a watershed moment for one of our region’s most important natural places — the Ballona Wetlands.
After years of delay, state and federal authorities released restoration plans Monday for the beleaguered 600-acre Reserve in the Playa del Rey area. Greater L.A. has already lost nearly 95% of its coastal wetlands, so we’re ecstatic to see officials finally moving forward to protect this ecological jewel.
But it’s not just scientists and enviro junkies who should care. Wetlands touch everyone in our region, no matter where we live.
- Do you like more thriving open space for all Angelenos?
- Do you like protecting habitat for local animals and native species?
- Do you like improved water quality throughout the region?
- Do you like natural buffers from the coming ravages of climate change?
- Do you like providing natural spaces for young students to explore?
If you answered yes to any of these questions, you already care about protecting and restoring wetlands.
Why Ballona Needs Our Help To Heal
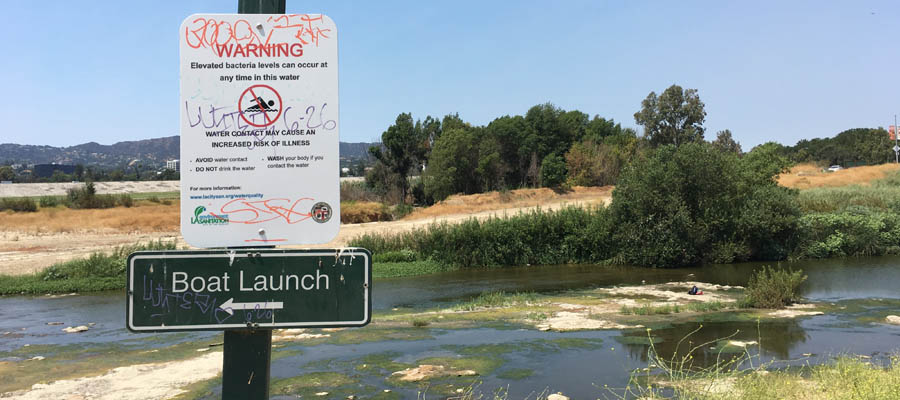
For Angelenos, Ballona Wetlands, located between Marina del Rey and LMU, are the largest wetlands habitat in the region. Unfortunately they are not healthy or functioning well and need our help.
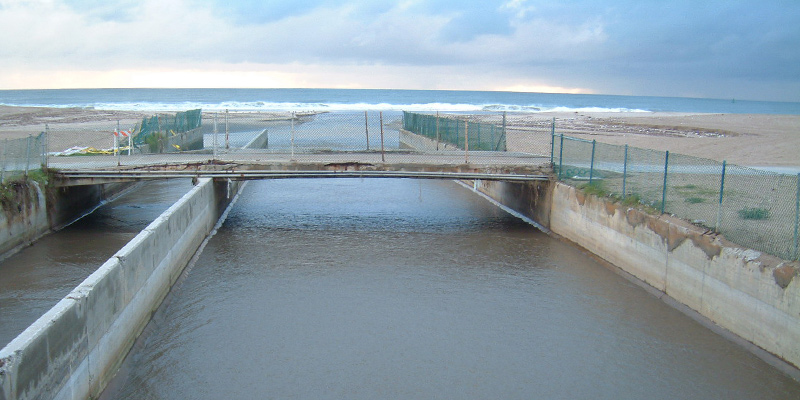
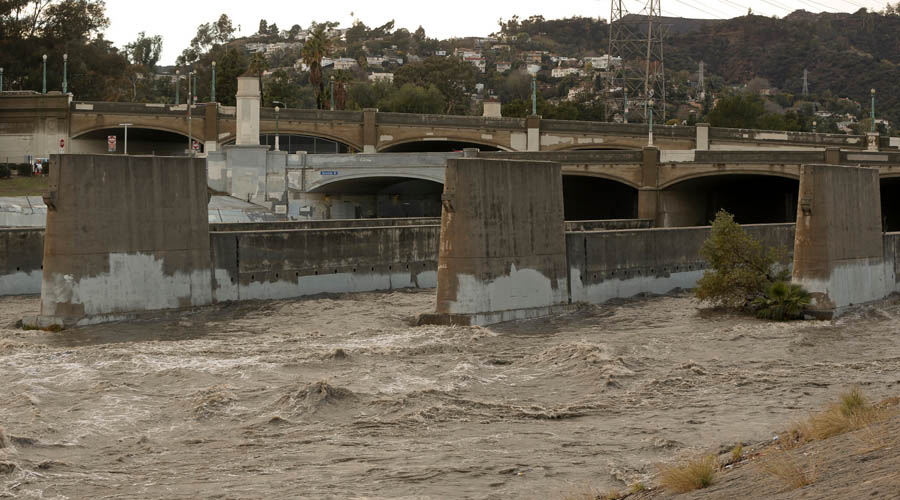
Decades ago, authorities building Marina del Rey dumped 3 million cubic yards of fill onto the wetlands – about 28 million wheelbarrows’ worth. Even before that, to protect against flooding, Ballona Creek was encased in concrete, removing the vital connection between land and water.
These actions served as a double-whammy – degrading natural habitat and starving the wetlands from essential sources of salt and fresh water.
One Step Closer To Restoring Ballona
Today the California Department of Fish & Wildlife and the U.S. Army Corps of Engineers released their long-gestating draft Environmental Impact Report/Statement (EIR/S), which presents three project alternatives for restoration. They examine the pros and cons of each alternative to meet the overall goals of the project, which are ecosystem restoration, increased public access and enhanced recreational use.
The good news is that the lead agencies seem fully and genuinely committed to a habitat restoration project that grows public access. Our staff scientists look forward to working with them to realize the option that we think best meets the goals for a healthy wetland.
The release of the EIR/S marks the beginning of a 60-day public comment period when anyone can weigh in on the plans.
Robust Restoration Is The Only Option
Heal the Bay is working together with a coalition of leading environmental groups and wetland scientists to advocate for restoration projects that put science first and maximize every opportunity to comprehensively restore our degraded wetlands.
Over the next few weeks, Heal the Bay will dive into the details and options highlighted in the restoration plans. The coalition doesn’t have a preferred alternative at the moment but will identify one in the coming weeks. It’s a thousand-page document – without the appendices! — so our team needs some time to thoughtfully review the EIR/S.
One alternative creates a more natural creek by removing concrete from Ballona Creek to reconnect the land to the water, north and south of the Creek; another alternative keeps the concrete along Ballona Creek but allows water to enter the floodplain north of the Creek, creating a so-called oxbow. Every EIR/S also has to examine the impacts of doing no project. You can see a nice review of the various options here.
Exact details of the restoration are still being worked out. But we can say for certain that we have to do something.
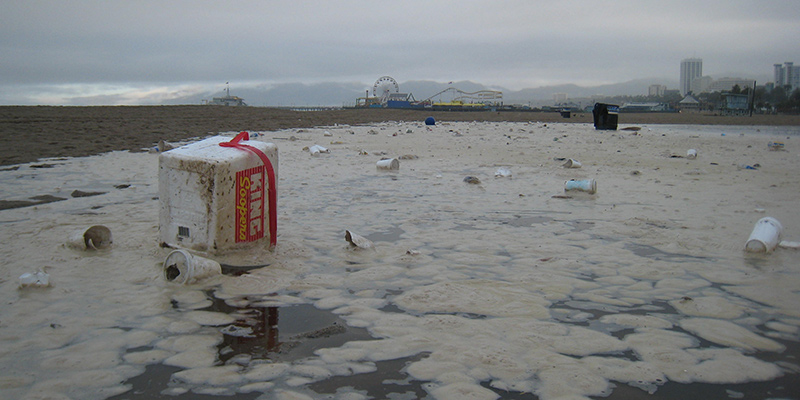
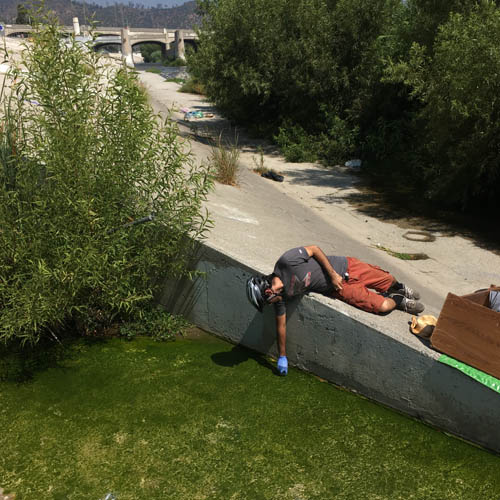
The Ballona Wetlands are highly degraded from fill, are too high in elevation and lack the critical connection to fresh and salt water. In addition, more than half the Wetlands Reserve has been taken over by non-native invasive plants, reducing economic, ecological, and social value.
If we just leave the Wetlands alone, and do no restoration work, they will continue to degrade. They cannot heal on their own.
It’s critical we help our local environment thrive. In L.A. County, on average we have 3.3 acres of greenspace per 1,000 residents – well below the national average for major metropolises. We can do better.
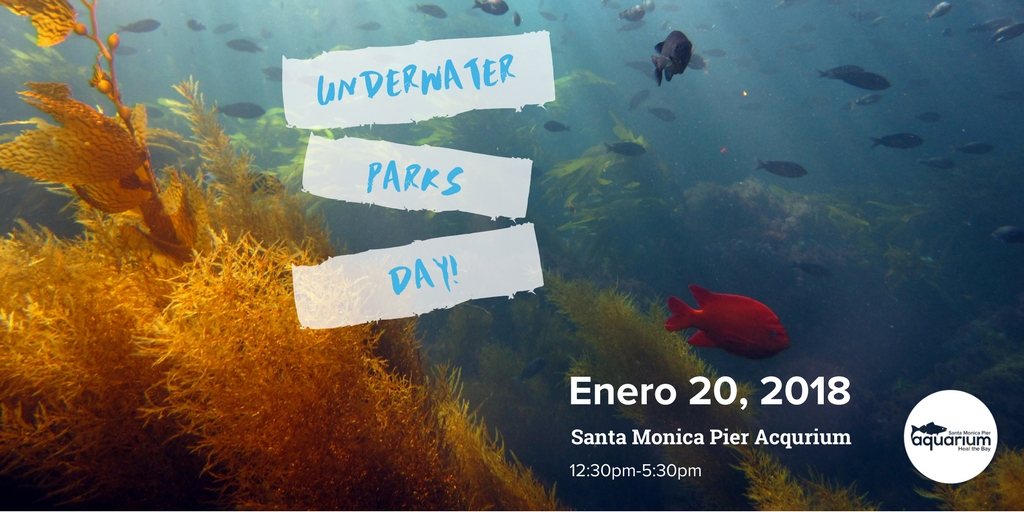
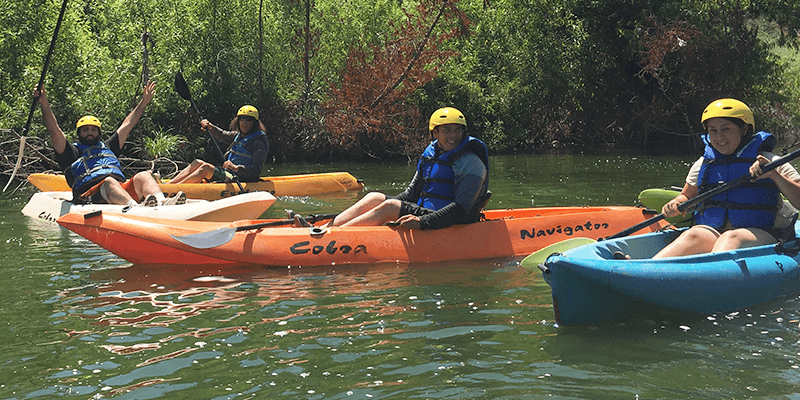
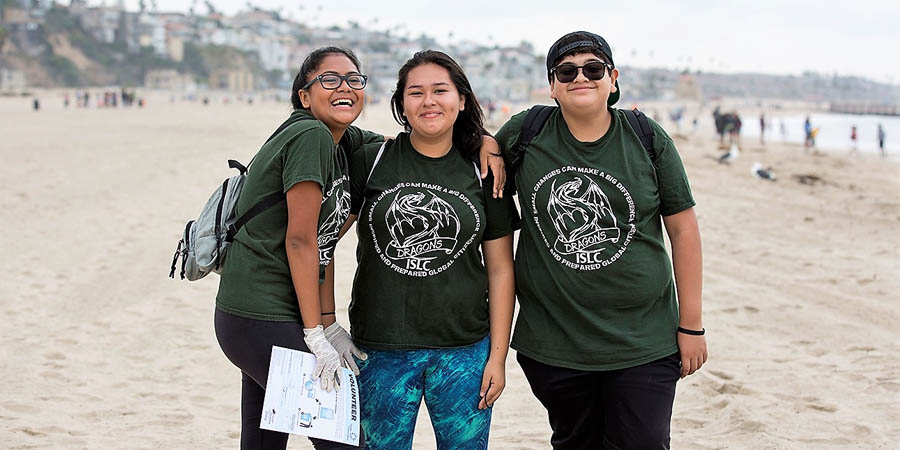
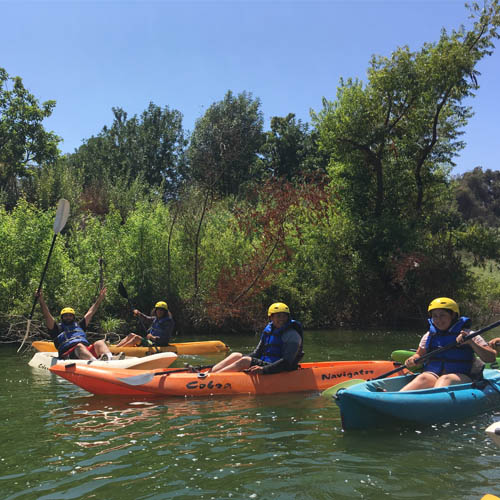
You’re Invited To Explore Ballona
Heal the Bay, along with our partners, is dedicated to Bringing Back Ballona. As part of this effort, we invite you to join us over the next month to discover the wetlands.
We’re hosting events so the general public can explore this amazing resource, see why it needs help, and understand its incredible potential.
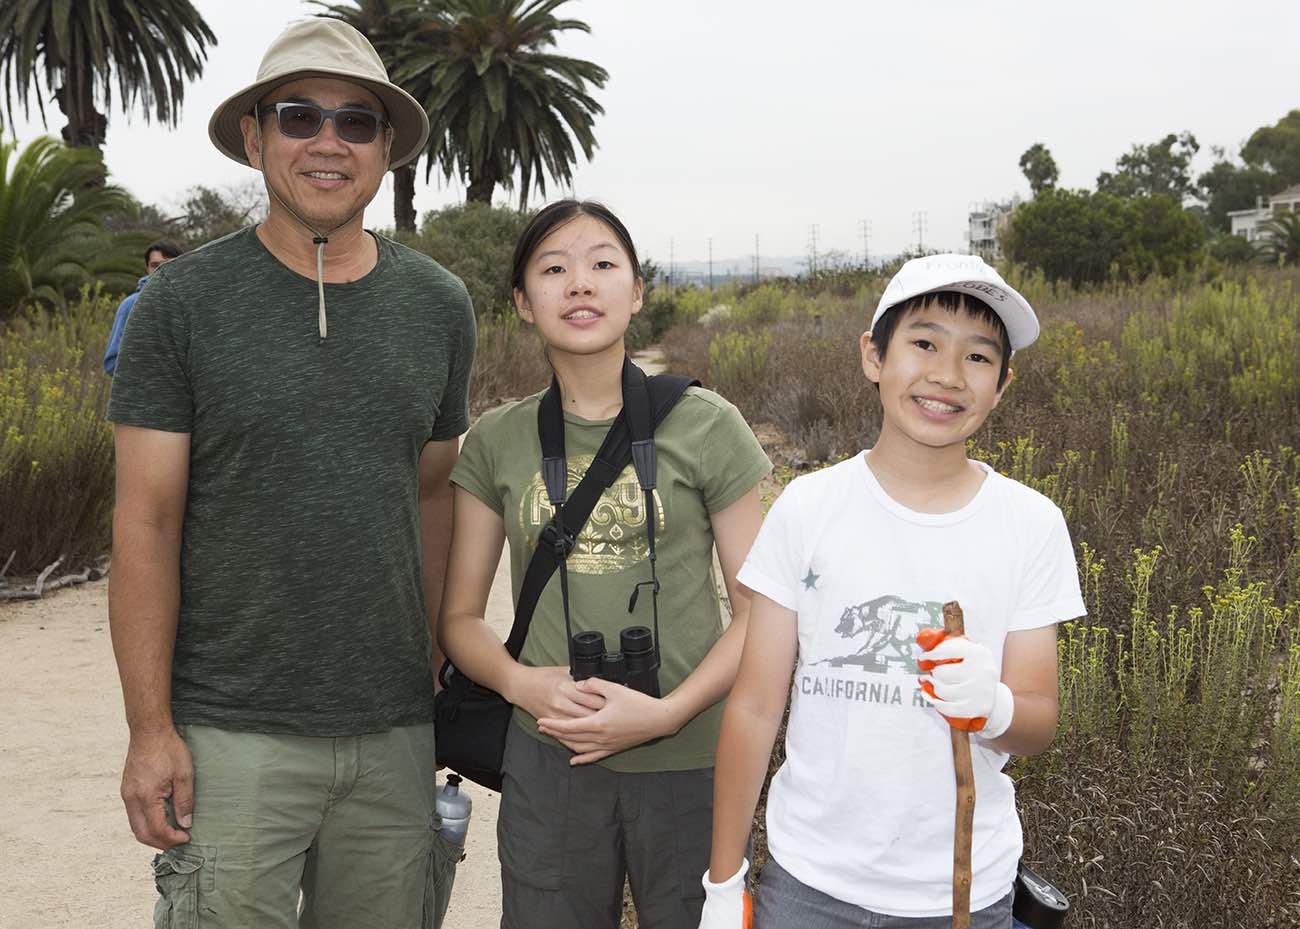
You can pick and choose from a number of fun and educational opportunities with our staff, partners and volunteers:
And stay tuned – as we review the alternatives for restoration, we will keep you informed. We are going to need your help. We need you to add your voice to help protect this special green space.
Send in your comments
Please email short letters of support calling for robust restoration of the Wetlands to the key decision makers — the U.S. Army Corps of Engineers and the state Department of Fish & Wildlife. Comments are due by Feb. 5.
U.S. Army Corps of Engineers: Daniel.p.swenson@usace.army.mil
California Fish & Wildlife: BWERcomments@wildlife.ca.gov