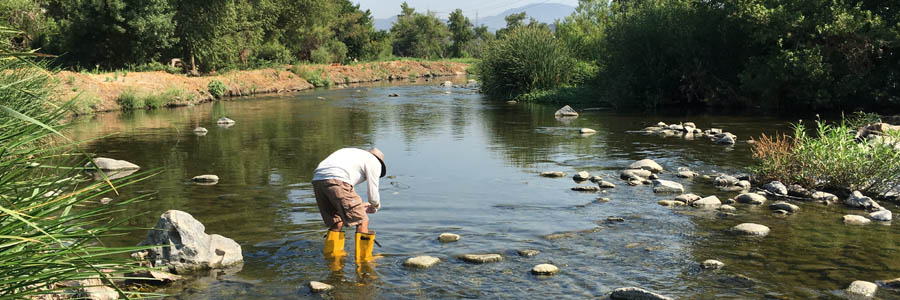
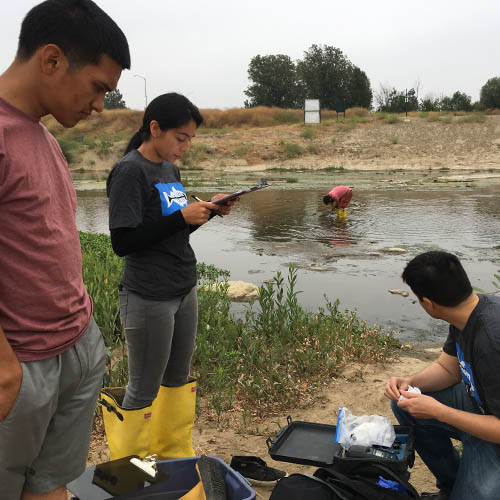
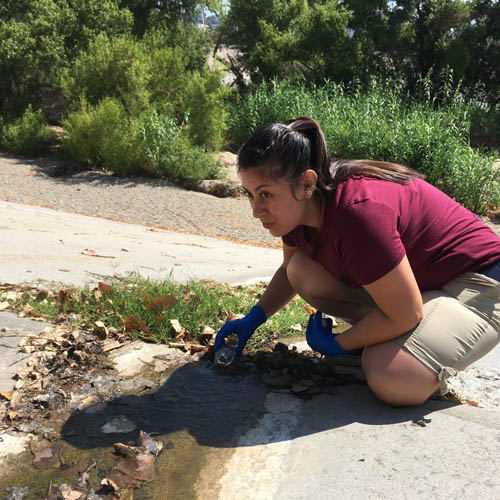
Blaire, Olivia, and Luke collecting storm drain samples along the Elysian Valley.
Luke Ginger, Water Quality Scientist at Heal the Bay, recounts the latest season of freshwater monitoring, reveals the disappointingly poor water quality grades, and explains what this means for public health and the future of the LA River.
The summer of 2019 marked Heal the Bay’s sixth summer sampling in Malibu Creek State Park and the fifth summer sampling in the LA River freshwater recreation areas. Currently, there is no federal or state mandate or funding for monitoring freshwater recreation areas as there is for ocean beaches. So local freshwater stakeholders monitor water quality in LA County with their own funds. Heal the Bay samples in various places to fill in some of the sampling gaps left by those organizations.
This season, we regularly monitored the Rock Pool and Las Virgenes Creek in Malibu Creek State Park, the LA River at Burbank Boulevard, and three sites in the LA River near Elysian Valley. We also sample the storm drains along the Elysian Valley to help us understand the origin and amount of bacteria entering the LA River. In total, our team collected 96 river and stream samples, and about 84 storm drain samples.
Disappointing Findings, Yet Encouraging Outreach
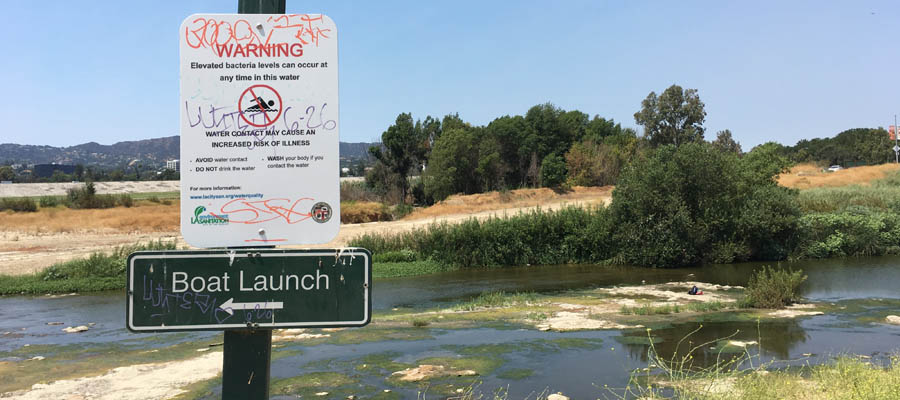
Grades in the LA River recreation zones were disappointingly poor this summer. The four sites we tested had good water quality (green grades) just 16% of the time on average. That means bacteria levels exceeded at least one standard (yellow or red grades) 84% of the time in the LA River. Malibu Creek State Park sites had similar water quality where green grades were issued 19% and bacteria exceeded standards 81% of the time. For the public, this means that water quality presents indicates a risk for human illness more than 80% of the time.
In addition to protecting public health by reporting freshwater quality grades, our mission is to conduct outreach and get more people invested in improving the health of the LA River Watershed. This summer was jam-packed with events that allowed us to spread our message and make an impact. We tabled at events along the LA River, participated in river cleanups (including the first-ever Trash Blitz at Compton Creek) and also collaborated with Pacoima Beautiful, FOLAR and CSUN to educate high school students on water quality in the river. This fall, we are continuing our student outreach by giving lectures at local high schools and providing students hands-on experience collecting water samples.
<
►
>
We tabled at the Wiltern for an Ice on Fire documentary event. We even got to take over the Wiltern’s Instagram account for the day!
Looking Forward
Protecting the public from potentially harmful water has been Heal the Bay’s mission for the past 30 years with the Beach Report Card, so our next step has been to provide the same water quality information for freshwater recreation areas. Because a healthy Bay starts with a healthy LA. To dive deeper into our freshwater work, check out our River Report Card. And stay tuned for the next release in Spring 2020, which will include a full assessment of these recent water quality grades.
We are also anxiously waiting for the release of the LA River Master Plan in December 2019, which is LA County Department of Public Works’ plan to revitalize parts of the river. We are eager to see an LA River that supports both nature and the surrounding communities without displacing them, so we urge everyone to follow the LA River Master Plan updates and get involved.
Our monitoring program also got some attention in the media!
Las áreas acuáticas para nado y recreación en el condado de Los Angeles brindan oportunidades importantes para quienes disfrutan y valoran la naturaleza de nuestros ríos y arroyos. Desafortunadamente, existe poca información o notificación pública de la calidad del agua por parte del estado. Como resultado, carecemos de datos estandarizados y la información disponible para el público es mínima y difícil de interpretar.
Durante más de 30 años, Heal the se ha dedicado a hacer que las aguas costeras y cuencas hidrográficas del sur de California sean seguras, saludables y limpias.
Desde 1991, Heal de Bay ha priorizado la salud pública, informando y educando a la comunidad sobre la calidad del agua de nuestras playas a través de nuestro “Boletín Informativo de Playas” (BRC, por sus siglas en inglés). Evaluar la calidad del agua en áreas de recreación acuática y brindar información al público en el condado de L.A. fue el siguiente gran paso de Heal the Bay. Un día de esparcimiento en las vías fluviales del condado de Los Ángeles no debería enfermar a nadie, por tal razón se estableció en el 2014 un programa de monitoreo en los sitios de recreación acuática y se desarrolló en el 2017 el programa River Report Card (RRC) o “Boletín Informativo de Ríos” para brindar al público información de fácil comprensión sobre la calidad del agua.
El RRC asigna calificaciones con los colores verde, amarillo y rojo en función a los niveles de contaminación bacteriana. Esto difiere del BRC de Heal the Bay, que asigna calificaciones a las playas con letras que van de la A a F; sin embargo, consideramos esta evaluación como un informe de calificaciones y nos referimos a los códigos de colores como calificaciones.
Desarrollamos una metodología de clasificación de verde, amarillo y rojo, así como también de sitios clasificados según los niveles de bacterias indicadoras de contaminación fecal. Verde indica buena calidad de agua con niveles de bacterias indicadoras de contaminación fecal bajo los límites permitidos por autoridades de salud. Amarillo indica que al menos uno o más exceden los límites permitidos y que puede aumentar el riesgo de adquirir enfermedades. Finalmente, el color rojo indica mayor riesgo de salud donde todos o casi todos los niveles de bacterias indicadoras de contaminación fecal superan los límites permitidos.
El “Boletín Informativo de Ríos” es el informe de calidad de agua más completo hasta la fecha en áreas de recreación acuática del área de Los Angeles. El conjunto de datos es recopilado por Heal the Bay, Programa de Monitoreo de la Cuenca del Río Los Angeles (LARWMP, por sus siglas en inglés), Oficina de Sanidad y Medio Ambiente (LASAN, por sus siglas en inglés) de la Ciudad de L.A. y Programa de Monitoreo Regional del Río San Gabriel (SGRRMP, por sus siglas en inglés). Los datos analizados fueron monitoreados durante la temporada seca 2017 y 2018 y cubre 27 sitios en su totalidad en tres cuencas hidrogróficas que son utilizadas para nado, pesca y kayak. Datos previos a estos años también están disponibles desde 2014, pero solo para determinados sitios. Se realizaron pruebas para detectar bacterias indicadoras de contaminación fecal que indican la presencia de microorganismos y virus que causan infecciones, irritación de la piel, enfermedades respiratorias y enfermedades gastrointestinales.
En todos los 27 sitios del año 2018, el 57% de las calificaciones fué de color verde, el 25% amarilla y el 18% roja. Las áreas urbanas tienden a tener calificaciones más bajas que las áreas naturales. Los sitios en las zonas de recreación de la cuenca del río de Los Angeles están rodeados principalmente de paisajes urbanos y tuvieron calificaciones más bajas que los otros sitios en este informe. Los sitios en las zonas de recreación del río de Los Angeles obtuvo 38% verde, 36% amarillo y 26% rojo. Los sitios de la cuenca del río San Gabriel y los sitios de la parte alta de la cuenca del río de Los Angeles obtuvieron las mejores calificaciones en general, probablemente porque se encuentran en paisajes naturales y no recibieron aguas de descargas urbanas que contienen contaminantes. Los sitios en la cuenca del río San Gabriel, que se encuentran en áreas naturales, obtuvieron 84% verde, 11% amarillo y 5% rojo para el 2018; los sitios de la parte alta de la cuenca del río de Los Angeles obtuvieron 70% verde, 13% amarillo y 17% rojo.
Los sitios de la cuenca de Malibu Creek se encuentran en un parque estatal y sus alrededores son en su mayoría áreas naturales, con algunos desarrollos urbanos en la parte alta de la cuenca. Estos sitios obtuvieron mejores calificaciones que los sitios en las zonas de recreación de la cuenca del río de Los Angeles, pero obtuvieron calificaciones más bajas que los sitios de la cuenca del río San Gabriel o de la parte alta de la cuenca del río de Los Angeles. Los sitios de la cuenca de Malibu Creek obtuvieron 50% verde, 39% amarillo y 11% rojo en el 2018.
Figura 1: Porcentajes de calificación de calidad de agua 2017 y 2018 para los sitios de monitoreo en el condado de Los Ángeles: Cuenca de Malibu Creek, zonas de recreación de la cuenca del río Los Angeles, parate alta de la cuenca del río Los Angeles y cuenca del río San Gabriel. Los colores verde, amarillo y rojo son mostrados para cada área y temporada.
Los dos sitios con porcentajes más altos en color rojo para el 2018 correspondieron a Hansen Dam (80%) en la parte alta del río de Los Angeles y Rattlesnake Park (58%) en la zona de recreación Elysian Valley del río de Los Angeles. Sin embargo, seis sitios obtuvieron 100% color verde; cuatro de estos sitios están en la cuenca del río San Gabriel y dos en la parte alta de la cuenca del río Los Angeles. En comparación con el año 2017, las calificaciones del 2018 en general, mejoraron para la cuenca de Malibu Creek, cuenca del Río San Gabriel y para las zonas de recreación de la Cuenca del Río de Los Angeles (el porcentaje para las calificaciones con color verde aumentó)
Al examinar los sitios individualmente, 15 de los 27 sitios obtuvieron un mayor porcentaje de calificación con color verde para el 2018 en comparación con 2017, 9 sitios obtuvieron un menor porcentaje de color verde y 3 no tuvieron cambios. En todo el condado, la proporción de calificación en rojo emitidos del 2017 a 2018 disminuyó en un 1%, y el porcentaje de calificaciones verde disminuyó en un 2%. Por lo tanto, a pesar de los aumentos observados en la calidad del agua, las disminuciones superaron ligeramente a los mismos.
Desde que Heal the Bay comenzó a monitorear los sitios acuáticos de recreación y hacer público los datos de calidad del agua, los cambios han sido positivos e incluyen:
Aumento del monitoreo bacteriano en zonas de recreación del Río de Los Angeles, tanto en sitios como frecuencias, realizados por LASAN.
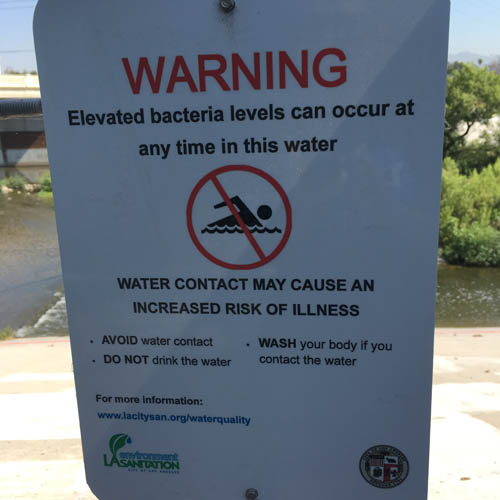
Mayor notificación pública por medio de letreros acerca de la calidad del agua a lo largo de las zonas de recreación del Río de Los Angeles, realizados por LASAN.
Mayor difusión pública e información sobre la calidad del agua a través de correos electrónicos, sitios web y otros medios en línea por parte de las agencias que recopilan la información (LARWMP, LASAN y SGRRMP).
Basados en este informe, recomendaciones adicionales para proteger la salud pública incluyen:
Notificación y monitoreo estandarizado en todo el estado y región para áreas acuáticas de recreación; designando responsables para el monitoreo y notificación, y recomendar una legislación o algo similar a la Ley de Calidad del Agua de las Playas (AB411) que proporcione financiamiento y monitoreos estandarizados a los condados que realicen la labor.
El monitoreo debe incluir los Enterococcus, así como también E. coli para proteger la salud pública y debe incluir la media geométrica en los avisos de calidad del agua.
La notificación pública debe incluir la publicación de carteles sobre la calidad del agua en todos los sitios de recreación acuática, en inglés y español.
Personas dirigiendose a áreas de recreación acuática pueden consultar el Boletín Informativo de Playas de Heal the Bay www.healthebay.org/riverreportcard Es recommendable ducharse con agua y jabón después de cualquier contacto directo con el agua para poder minimizar cualquier riesgo de salud.
A day spent enjoying the waterways of L.A. County should not make anyone sick.
Heal the Bay today released the annual River Report Card, which assigns water quality color-grades of Red, Yellow, or Green for 27 freshwater sites in Los Angeles County. Grades are based on levels of bacteria monitored in 2018 and prior years.
Our staff scientists put a ton of work into this comprehensive study of bacterial pollution in our local waterways. We encourage you to soak up all the stats and charts we’ve assembled in the report, so we are all better informed about water quality in our region.
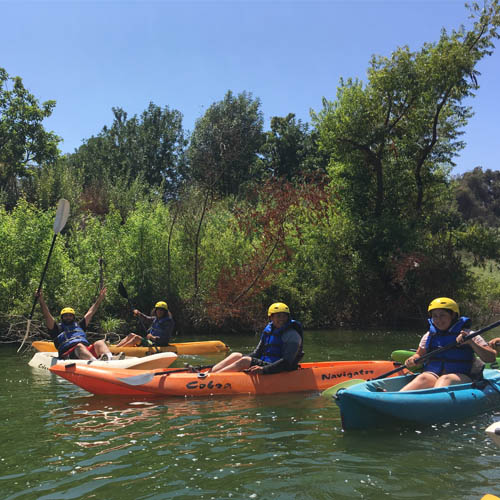
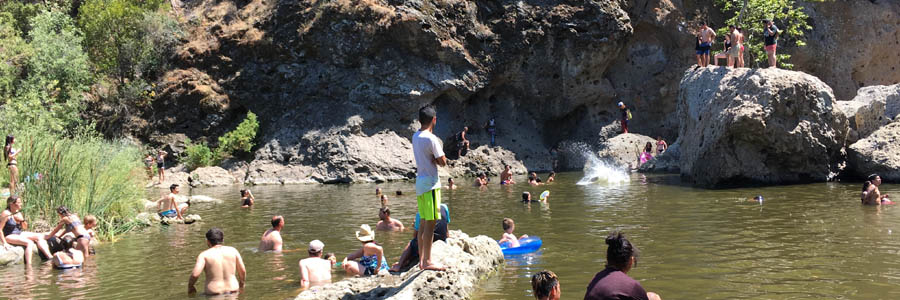
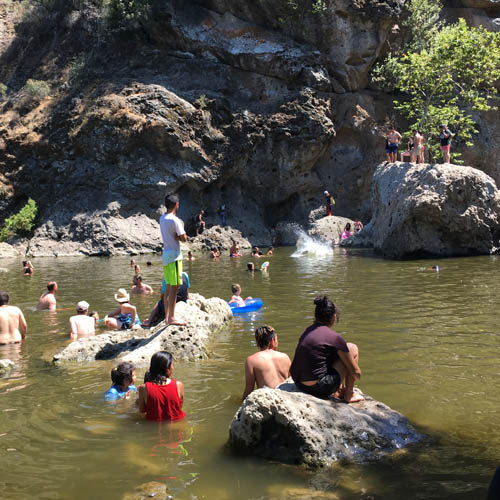
The River Report Card is the most comprehensive water quality report to date on bacterial pollution in popular freshwater recreation areas within the Los Angeles River Watershed, the Malibu Creek Watershed, and the San Gabriel River Watershed. These valued public places are often used for swimming, wading, fishing, kayaking, and other activities, especially during summer months when communities seek relief from hot SoCal days.
Here are some of the major findings:
The good news is that over half of all the water quality samples taken at freshwater sites in 2018 received Green grades – so bacterial levels were not a cause for concern at the time of the sampling.
However, there is a significant risk of getting sick from freshwater contact in Los Angeles County during dry weather. In 2018, 43% of water quality samples monitored by Heal the Bay came back as Yellow or Red, signaling a moderate to high public health risk.
The River Report Card features a Top 10 Freshwater Fails list. Taking the top spot with the worst grades overall was Hansen Dam, located in the Upper L.A. River Watershed, which had the highest public health risk (this site received Red grades in 80% of water samples taken!). Just last week, it was reported that over twenty lifeguards in L.A. developed rashes after swimming at Hansen Dam. See the full list of Freshwater Fails on page 10.
The River Report Card also includes a Top 10 Honor Roll list of the freshwater sites with the best grades overall. Six locations earned perfect Green scores in every sampling, including four sites in the San Gabriel River Watershed and two sites in the Upper L.A. River Watershed. Heal the Bay recommends that the public head to Hermit Falls and the East Fork San Gabriel River areas for freshwater swimming, based on the 2018 water quality analysis. Water quality conditions are subject to change so it’s best to check the latest available data when choosing a swimming hole. View the entire Honor Roll list on page 11.
Freshwater sites in more natural areas tended to earn better grades than freshwater sites near development. Read the report’s conclusions on page 22.
Better State and regional oversight and funding are needed for monitoring and public notice of water quality in freshwater recreation sites. (Our full recommendations starting on page 25) Monitoring protocols and public notification in L.A. County are not standardized, and government agencies only test for E. coli. Testing should also include the fecal indicator bacteria Enterococcus. Solely monitoring for E. coli might be putting the public at unnecessary risk. More on page 23.
The River Report Card includes storm drain monitoring. See which eight storm drains in the L.A. River Elysian Valley Recreation Zone need to be prioritized for runoff remediation on page 29.
Tips for enjoying and staying safe in L.A.’s rivers, streams, and creeks
Before heading to a freshwater recreation area in L.A. County check out Heal the Bay’s River Report Card at healthebay.org/riverreportcard(New data coming on Memorial Day). If water quality is poor (Yellow or Red), consider choosing a site that has good water quality.
People can also minimize their risk by limiting water contact, avoiding submerging their heads underwater, avoiding hand-to-face water contact, and washing off after contact using soap and clean water. For all water recreation, users should avoid entering the water with an open wound, if immunocompromised, or after a rainfall. Always heed official regulatory signs posted by the City or County. Swimming is always prohibited in the L.A. River main channel.
About the River Report Card
We believe the public has a right to know about the conditions of our local waterbodies, and to make informed decisions about how they want to experience them. That’s why Heal the Bay developed the River Report Card — the most comprehensive water quality report to date on freshwater recreation areas in the greater Los Angeles area.
Heal the Bay began monitoring freshwater recreation sites in 2014 and developed the River Report Card program in 2017 to provide easy-to-use water quality information to the public. Water quality grades are based on the levels of fecal indicator bacteria (E. coli and Enterococcus) and are displayed as Red, Yellow, or Green. Green means there is a low risk of illness when there is contact with the water. Yellow indicates a moderate risk, while Red signals a high risk.
Since Heal the Bay started monitoring freshwater recreation sites and making water quality data public, some positive changes have included increased bacterial monitoring and public notification signage in L.A. River recreation zones as well as increased dissemination of water quality information to the public through emails, websites, and other online means by government agencies collecting water quality information. Our annual River Report Card 2018 includes additional recommendations for water quality monitoring and public notification protocols to be the most protective of public health.
Heal the Bay also manages the Beach Report Card, available at beachreportcard.org, which provides A-to-F letter-grades for water quality at hundreds of beaches on the West Coast.
(Heal the Bay’s River Report Card Team – From Left to Right: John Silva, Christopher Zamora, Dr. Katherine Pease, Vanessa Granados, Yuris Delcid and Nelson Chabarria)
Revitalizing the L.A. River is one of our big goals for 2018. But what is water quality monitoring really like in this increasingly popular outdoor area? Heal the Bay’s River Report Card team, led by Dr. Katherine Pease, is responsible for bringing Angelenos the latest water quality grades from the L.A. River during the summer. The team shares their first-hand experiences below from last summer, including a behind-the-scenes video that takes YOU into the L.A. River during a monitoring trip.
River Reflections & Looking Ahead to Summer 2018
By Dr. Katherine Pease
Summer feels long over, but the memories are still fresh. This past summer marked the completion of our 3rd season of water quality monitoring at fresh water recreational areas in the Los Angeles River and our 4th season at popular swimming spots in Malibu Creek State Park.
The summer of 2017 was especially exciting because we launched our River Report Card, which grades sites based on bacterial pollution levels. We provided the public with weekly water quality information for 18 sites around L.A. County. In 2018, we will add another 9 sites in the San Gabriel River watershed as we continue to grow this program.
Another deeply satisfying aspect of this past summer was the involvement of local students. Through the U.S. Environmental Protection Agency’s Urban Water funding grant that we received, we were able to hire five Los Angeles Trade Technical College (LATTC) students for the summer to conduct water quality monitoring. In addition to scientific training, the team was also trained in communications (social media, blogging and outreach).
After their summer in the river, the River Report Card team created blog articles for the public and presentations for local high school students about their L.A. River monitoring project. Our goal was to engage more people in science and the environment with real-world examples and first-hand storytelling.
The culmination of months of work happened when our LATTC students presented to two Environmental Science AP classes at Thousand Oaks High School in the fall of last year.
Many of the Thousand Oaks high school students didn’t know much about the L.A. River or that you could kayak in it. The LATTC students told personal stories about their experiences in the L.A. River and how they were surprised at the number of plants and animals that call it home, how it is actually very deep in some sections (verified through an accidental kayak spill), and that pollution, both seen and unseen, unfortunately remains a major problem. Watching them present so passionately gave me a sense of excitement for our next generation of environmental leaders and problem solvers.
This year, we will be releasing a more technical wrap-up of our water quality results from summer 2017; some of the students will continue working with us on data analysis, report writing, and giving more presentations to high school students and agencies. We are sad but thrilled that one student will be leaving us to transfer to Arizona State University in January to study Geology.
As we look back on this amazing season, we share these personal stories below, written by the LATTC students on their experiences at the L.A. River. Enjoy!
Seeing the L.A. River From A Fresh Perspective
By Yuris Delcid
As a student of nursing, one of my goals has always been to help people in a positive way. When I heard about Heal the Bay, I felt I needed to join the crew.
I began my L.A. River Monitoring internship with Heal the Bay in the summer of 2017. It has taught me so much about the environment, why we need to care for the ocean, and the importance of educating the community on how to help.
One of the coolest parts of my Heal the Bay internship was envisioning how different the L.A. River could be, compared to how it appears in Hollywood movies! The L.A. River is not only concrete; it has natural wildlife living within. It’s amazing to see the L.A. River from this fresh perspective. Seeing all the different natural plants growing, birds watching me as I’m grabbing my water samples — observing rarities like an “albino fish” — I feel so much peace and this makes me love what I do when I’m there.
Monitoring the L.A. River has changed the way I think about waterways. Testing the water quality for different types of bacteria, in example; E-coli and Enterococcus, has been eye opening. At first, it was surprising to discover which spots had the highest and lowest levels of bacteria in the river. Now I have a deeper understanding of where the water comes from and where it is discharged. And this knowledge informs how we can help keep the L.A. River clean, and how to protect marine life by keeping the oceans and water free of trash and pollution. I wish more people knew about their local watersheds in this tangible way.
This internship with HtB has given me more knowledge than I expected about water quality. I take overall precautions when I want to go to the beach or kayaking in a local creek or river. The experience has also given me tools to spread awareness of how important it is to stop water pollution.
So many people can care about the environment and take action to make a difference. We can all start making some changes in life. We can simply start by pledging not to use plastic straws, use reusable water bottles and/or stop using plastic bags.
My long term goals are to graduate as a Registered Nurse and help people by caring for them when they need me the most. This internship has taught me that you can accomplish your goals with perseverance and patience. Our work with the L.A. River has taught me that advocacy can engage more people in the community in making a difference.
Finding Purpose in the Process
By Vanessa Granados
I am inspired by nature and all that it brings. When I was seeking internships in my area of study (Chemical Technology) I found that most opportunities existed within the refinery, pharmaceutical, and food industries. I have always been inclined to the environmental side.
When I heard of the opportunity with Heal the Bay, I was excited to learn it was a non-profit environmental organization. It was the perfect route for the start of my career in order to gain environmental field experience.
After three months of working in the field, I have learned many observational and technical skills. One of the greatest things I’ve learned is how to record all the information and results. This scientific process is a big factor for anyone in the technical field. It’s a skill you have to learn. Plus, you should always be ready with the evidence to prove your results and conclusions. When you’re out in the field and lab, it’s important to follow procedures and be detail-oriented, so the final results have accurate context and information.
I had the opportunity to work in the L.A. River and see the vegetation and wildlife that thrives there. Yet many people do not know about it. I’ve seen crawfish, ducks, birds, eagles, red dragonflies, fish and rabbits. It is truly amazing to observe a flock of ducks or birds swimming down the stream with their family. It sparks a sense of initiative to do more for the L.A. River, so it can continue to flourish and eventually bring back diverse species to the river.
This internship has helped me contribute, and learn more about how to help our watersheds. By understanding what’s going on in the water, you are helping to protect our environment and health. Going out every Friday during the summer, collecting water samples to bring back to the lab, and analyzing for E-Coli is one way to monitor bacteria levels in the water. We do this to inform people about what’s going on in the L.A. River, whether they are kayaking, walking, or just enjoying the scene on a morning walk. The River Report Card from this summer is available online at Heal the Bay’s website: https://healthebay.org/riverreportcard/
My main goal when first applying was to help clean the waterways of Los Angeles. Growing up in this city I’ve seen much the streets littered with trash and smog in the air.
I was pleased to find out how much effort Heat the Bay puts into keeping the waterways of Los Angeles clean. When coming out of high school my only knowledge of Heal the Bay was that they held beach cleanups.
We were taken to sites all along the L.A. River to collect sample of the water to test for bacteria. We were given boots to wade in the water, but one site in particular was clean enough to go into bare foot. We graded the quality, based on how great of a risk if any, it presented to recreational water use.
Storm drain monitoring was something I was completely unaware of. The location of a storm drain can determine the origin of certain outflows and helps locate suspicious activity.
Although there is much work to be done, it’s a great feeling to know we are doing all we can to make the waters safe. Overall the best part of this internship was kayaking down the River. It was an experience I will remember for a lifetime and has encouraged me to get my own kayak and explore more waterways around the world.
During our outing, we were accompanied by an L.A. River guide who informed us of the flooding during the wet seasons and how trash accumulates along the riverbed near the dam. Plastic bags and trash could still be seen on treetops and lodged in bushes. Plastic was present at almost every testing site in the L.A. River, too. I wish people were more informed about how much trash and plastic end up in the water and ocean.
A long-term goal of mine would be to help inform people of the repercussions they have on the environment around them, animals and wildlife to be specific. One field of research I look forward to is Biological research, mainly human impact on surroundings. Through Heal the Bay, we can help reduce the amount of man-made waste and balance ecosystems to their natural homeostasis.
An Oasis in the City I Love
By Christopher Zamora
Growing up in Austin, TX I always found myself exploring the outdoors. The city is a green oasis in the middle of hot and dry Texas, surrounded by lakes and parted by the Colorado River. Camping was a ritual, hiking came naturally, and rock collecting became my obsession after visiting deep caverns in elementary school. I enjoyed all the natural landscapes the city and state had to offer. I was uncertain if I’d be able to keep these activities going when I moved to Los Angeles right before junior year of high school.
The sight of the concrete channel containing the Los Angeles River was strangely beautiful when I first glanced at it from the 4th Street Bridge, linking downtown to Angelenos east of the stream. Maybe because of Hollywood films and trending, record-breaking shows like Fear the Walking Dead, featuring the river in its gray concrete slabs. This famous view of the river, cemented and narrow, can be easily spotted in urban photography, music videos, and movies.
It wasn’t until my internship at Heal the Bay started that I began to venture into the Los Angeles River ecology and surround myself with places so unfamiliar and alien to the city.
Green, soft-bottomed, flora-and-fauna was thriving community in the middle of the city! It was so relieving to see the natural river zones. The great blue herons, blue damselflies, and western tiger swallowtail butterflies made the air seem “breathable” again. I had forgotten about the crowds and smog, and got lost in the tall greenery along the edges and center of the river.
The most prevalent color I noticed in the surrounding vegetation was a faint, dull green, very light in hue. The color belonged to a stalky cane-like plant. These tall plants dominated the area, grew in colonies, and varied in size from 3ft to 25ft in some areas. The team and I were informed by Dr. Pease that the plant, Arundo donax, was invasive and displacing the native plants.
We quickly realized the damage of the invasive species after seeing recently eradicated “arundo” stretched across the concrete bank next to the L.A River near Rattlesnake Park; looking back at the river with unfocused eyes, the dominance of the burgeoning plant really dramatized the scene.
It still surprises me how I manage to get startled by the random presence of arundo during our field work. It can be towering, and feel as if you and the river are being loomed-over together. Even the newly growing, short stalks can outnumber the group and myself. Any recreational kayaker, canoer, runner, walker, cyclist, fishermen/women, and near-stream park goers can catch a glimpse of these bad babies by just scanning the river briefly and looking for the contrasting stalky bamboo-type plant. It looks like a mass of unwanted neighbors disturbing and delaying the ambience of an upcoming thriving community. Learning about these types of issues made me aware that there is more to the health of the river than meets the eye, and it’s important to dig below the surface to learn about water quality and wildlife conditions.
The Time I Was In The Times
By Nelson Chabarria
We were in the school library – finishing up some data entry. The River Report Card had been released a week prior and we were about to refresh it with the latest test results. Weeks and hours and sunburns went into the grades, and to make them publicly available was simply gratifying. This moment felt pretty cool.
I was born and raised here. I’ve seen this “river” as I crossed the bridge to and from East L.A. I always thought of it as a ditch that divided the city. I am glad I was wrong about this. The river has its own ecosystem and interested groups that are invested in it.
I started classes in LATTC to come out of it working with some sort of water filtration or conservation leaning career. I want to be able to contribute in some way to making sure my city is smart in how it treats and uses the water we receive.
I never gave storm drains a second thought while driving. The few times they took my attention was during heavy storms where they flooded – the pooled water splashing unlucky pedestrians as cars passed. Sometimes I was unlucky. Now I am aware of its function, their contribution to the way water is handled here, and the importance of NOT contaminating streets with trash or toxic waste.
On a personal note it was great to come out and be featured in an LA Times newspaper article. I had explained the work to some family, but not all. I never expected to talk to a reporter about my background and the work I do in the river. Once the article was released it spread to people that were unaware of the work I was doing. The bombardment of questions, congratulations and support was one of the best feelings to come out of this program. I cannot thank Heal the Bay enough for making this possible.
My job was the same each week. I went out and collected samples. The next day they were read and the data was collected and posted. Even though it is the same every week, each time is always filled with new experiences. It can come from the people we meet at the river or the dynamics of our great team.
Heal the Bay’s internship program covered a wide range of public service opportunities in the water systems of Los Angeles. The idea, team and process meshed right in with what I am interested in. It is one of the main reasons why I decided on coming back into school during the summer!
Meet the Team
Heal the Bay has monitored water quality in Malibu Creek since 2014 and in the L.A. River since 2015. In the fall of 2016, we were awarded the U.S. EPA Urban Waters Grant. As a result, we have launched a unique freshwater monitoring program in partnership with a local college. Led by our very own watershed scientist Katherine Pease, we’re training five awesome Los Angeles Trade Technical College “LATTC” students to monitor the conditions in the L.A. River. We’re also working with two outstanding interns who support our Malibu Creek efforts.
Heal the Bay Staff
Dr. Katherine Pease Longtime Heal the Bay staffer, Katherine has extensive experience assessing the water quality and biological health of greater L.A.’s watersheds, as well as assisting stakeholder groups with policy recommendations.
Annelisa Moe Annelisa helps to keep L.A. water clean and safe by advocating for comprehensive and science-based water quality regulation and enforcement. Before joining the team at Heal the Bay, she worked with the Regional Water Quality Control Board.
L.A. River Monitors (Summer 2017)
Nelson Chabarria A native Angeleno, Nelson is obsessed with his pet pug, Goose. He is thrilled to be part of this L.A. River monitoring program.
Yuris Delcid Hailing from El Salvador, Yuris is going to LATTC to get her Associate’s Degree in Registered Nursing. Nothing is more important to her than her family (except for maybe her two cats).
Vanessa Granados Vanessa is attending LATTC for her Associate’s Degree in Chemical Technology. She plans to continue studying for a B.A. in Environmental Science or Agriculture, and to engage in activism for natural ecosystems.
John Silva Majoring in Biology, John is passionate about animal welfare. He strives to one day open a holistic care center for domesticated animals.
Christopher Zamora Christopher’s concerns are global; he aspires to participate in environmental geochemical research and to one day become an activist to improve (inter)national guidelines and policies.
LATTC Staff
Manuel Robles Manuel Robles has been the Life Sciences Laboratory Technician at LATTC since 2012. He received his Bachelor’s in Biology from Cal State Long Beach and gets to work on the coolest biology projects.
Malibu Creek Watershed Monitors (Summer 2017)
Melissa Rojas Melissa recently graduated from UC Davis with a B.S. in Environmental Science and Management. During her time there, water became a focal point for her studies in conservation and management.
Andrius Ruplenas Born and raised in Santa Monica, Andrius studied at Santa Monica College for two years before transferring to Northern Arizona University, where he’s currently majoring in Environmental Studies. He just returned from a semester abroad in Costa Rica, where he got the chance to explore while studying Spanish.
Nelson Chabarria always dreamed of being a chemist. Then life got in the way. With his Koreatown family needing help to make ends meet, Nelson had to hang up his lab coat and love of science after graduating from Los Angeles High in 2001. He took a job working in L.A.’s Garment District.
Some dreams die hard, but thanks to Heal the Bay, Nelson is back in the lab – testing water samples from the Los Angeles River for harmful pollution. Nelson and four classmates from Los Angeles Trade Technical College spent the summer working with Heal the Bay staff scientists to monitor newly opened recreational zones along the river.
The good news is that all of Nelson’s hard work has paid off. Because of his team’s monitoring, we demonstrated that popular recreational zones are riddled with bacteria that can make kayakers and swimmers sick. After we publicized the results, the city of Los Angeles launched a formal protocol for posting troubled areas of the River and notifying the public about potential threats.
Here Nelson, now 34, tells what the program means to him as an East L.A. native and how it has affected his life:
We were in the school library – finishing up some data entry. The River Report Card had been released a week prior and we were about to refresh it with the latest bacterial test results. Weeks and hours and sunburns went into the grades, and to make them publicly available was simply gratifying. This moment felt pretty cool.
I was born and raised here. I’ve seen this “river” as I crossed the bridge to and from East L.A. I always thought of it as a ditch that divided the city. I am glad I was wrong about this. The river has its own ecosystem and interested groups that are invested in it.
I started classes in LATTC to come out of it working with some sort of water filtration or conservation leaning career. I want to be able to contribute in some way to making sure my city is smart in how it treats and uses the water we receive.
I never gave storm drains a second thought while driving. The few times they took my attention was during heavy storms where they flooded – the pooled water splashing unlucky pedestrians as cars passed. Sometimes I was unlucky. Now I am aware of their function, their contribution to the way water is handled here, and the importance of NOT contaminating streets with trash or toxic waste.
On a personal note it was great to be featured in an LA Times newspaper article. I had explained the work to some family, but not all. I never expected to talk to a reporter about my background and the work I do in the river. Once the article was released it spread to people that were unaware of the work I was doing. The bombardment of questions, congratulations and support was one of the best feelings to come out of this program. I cannot thank Heal the Bay enough for making this possible.
My job was the same each week. I went out and collected water samples. The next day they were read and the data was collected and posted. Even though it was the same every week, each time was always filled with new experiences. The memories come both from the people we met on the river and the dynamics of our great team.
Heal the Bay’s internship program covered a wide range of public service opportunities in the water systems of Los Angeles. The idea, team and process meshed right in with what I am interested in. It is one of the main reasons why I decided on coming back into school during the summer!
Our work isn’t possible without the real passion, action and commitment from people like Nelson and you. Help us spark more positive change in our region, up and down the coast, and around the world.
Update (9/10/17): Bacteria levels remain very high in Sepulveda Basin. Most sites also exceed regulatory limits in Elysian Valley, although amounts of bacteria are lower than earlier this week. Based on these latest sampling results, we still recommend avoiding water contact with the L.A. River.
Heal the Bay is urging the general public to avoid the waters of the Los Angeles River this weekend because of alarmingly high levels of bacterial pollution.
Our staff scientists collect weekly water quality samples at four sites in the Sepulveda Basin and Elysian Valley, areas of the L.A. River that have become popular for kayaking, fishing and other recreational activities. The levels of bacteria are at the most worrying levels since Heal the Bay began monitoring L.A. River sites in 2015.
The results have a special urgency this weekend, as the fourth annual L.A. Boat Race is scheduled to take place at the Glendale Narrows (Elysian Valley). Dozens of kayakers are expected for the boat pageant and parade.
Samples taken on Sept. 6 in the Sepulveda Basin by the City of L.A. Sanitation Department showed very high levels of bacteria, well over accepted regulatory and health limits. The poor results are possibly related to runoff from recent thunderstorms and rains. A fish kill in the Balboa Boulevard area of the Basin has also likely degraded water quality. Low-oxygen levels, high turbidity and increased ammonia levels have been cited by city officials as contributing factors to the fish kill.
Additionally, Heal the Bay scientists and other monitoring groups recorded very high levels of bacteria on Sept. 1 and Sept. 4 in the Elysian Valley area. Rainstorms and poor upstream water quality likely led to the spike in such bacteria levels (the presence of which indicate an elevated risk for ear infections, respiratory illnesses and gastrointestinal illnesses for people who come in contact with the water).
Heal the Bay urges people to stay out of the water and to delay any planned kayaking trips until water quality results show marked improvement. Our staff scientists expect to get updated bacteria counts this weekend (please check our Twitter and Facebook pages on Sunday as we’ll be posting the results).
Unlike at the beach, there is not yet an official protocol for authorities to alert the general public or kayak outfitters when potentially dangerous levels of bacterial pollution are found at popular recreation zones at the L.A. River. The only way for the general public to know about potential threats to their health is to access water quality data on Heal the Bay’s River Report Card, which is updated weekly.
Heal the Bay looks forward to working with the City of Los Angeles and the L.A. County Department of Public Health to resolve jurisdictional conflicts about health oversight of the L.A. River. This effort should hopefully lead to formal protocol for proactively warning kayak operators and the general public as soon as they know bacteria levels exceed safety thresholds.
Every year thousands of people recreate in the L.A. River. In 2014, approximately 6,000 people utilized the recreation zones, according to the Mountains Recreation and Conservation Authority.
The L.A. River has been designated by state regulators as a bacteria-impaired waterbody. The Los Angeles Regional Water Quality Control Board has identified several conduits of bacteria to recreational zones along the river: urban runoff, leaks and flows from wastewater collection systems, illicit connections and failing septic systems. Bacteria sources include pets, horses and human waste.
Experiencing the L.A. River firsthand is an undeniable way to make a connection to a river that needs supporters and advocates; many Heal the Bay staff members and volunteers have kayaked the L.A. River over the years and will continue to do so. We also believe that the public has a right to know what the water quality of the river is and then to make an informed decision about how they want to experience the river.
If you are thinking about getting out on the water, please check out our FAQ about recreation and water quality issues along the L.A. River.
Most people view Labor Day weekend as the last celebration of summer and a final opportunity to enjoy a relaxing water adventure either at the beach or the river. A last hurrah before settling into the fall season. With that in mind, now is a good time to deliver a friendly reminder about water quality when heading to your favorite beach or stream.
First – let’s remember the basic safety tips.
These are some general rules to follow to lower your risk of getting sick when:
Going to the beach
Swim at least 100 yards from piers and flowing storm drains.
Because of poor circulation, water quality at enclosed beaches and harbors is often poorer than at open beaches.
Wait at least 3 days after a rainstorm before diving into the water (and wait at least 5 days before swimming at beaches near storm drains).
Going to the river
Do not drink the water.
After water contact, rinse off with soap and water.
Be aware of your swimming conditions (funny smells, homeless encampments, nearby drainages, posted signs) before entering the water.
Second – knowledge is power.
Heal the Bay has two great, if not awesome, sources of water quality information regardless of whether you are going to the beach or the river. In addition to practicing safe swimming, water enthusiasts should visit Heal the Bay’s Beach Report Card to get the latest information on all California beach conditions. (We publish the Beach Report Card on a weekly basis for the whole year, so can stay informed if you plan on swimming in the ocean beyond Labor Day Weekend.)
If you plan to visit a swimming hole in Los Angeles County this coming weekend, then see our River Report Card to see updated water quality information about these swimming holes.
Our motto has always been, and always will be: KNOW BEFORE YOU GO!
Today we begin publishing regular water quality grades for freshwater recreational zones across greater L.A. Staff scientist Dr. Katherine Pease explains why the work is so important, and some interesting people helping us do it.
Last summer, Heal the Bay released a landmark study of water quality that showed that bacterial pollution continues to plague the L.A. River on a chronic, long-term basis. Our scientific report demonstrated that increasingly popular recreation zones suffered from poor water quality, and posed health risks for the growing number of people fishing, swimming and kayaking its waters.
The findings were a cause for concern, but also served as an opportunity – given all the renewed interest about the L.A. River and a $1 billion revitalization plan for L.A.’s central water body.
Building on that study and our longtime work to protect public health by providing weekly water quality grades at California beaches, Heal the Bay this year committed to regular water quality monitoring in rivers throughout greater L.A.
Today, we take the wraps off our River Report Card, a new online tool that lets users check for harmful bacteria levels at nearly a dozen freshwater recreational zones, stretching from Malibu to Frogtown, from Encino to Atwater Village.
We began monitoring inland recreational areas in 2014, starting with swimming holes in the Santa Monica Mountains, and adding sites in the L.A. River in 2015. To make sure people could see whether these popular spots are clean and safe, we posted the test results online in a weekly blog.
With our expanded River Report Card, the public can use our online map to check out water-quality ratings (green, yellow, or red) at their favorite summer spot. We will update the grades twice a week, every Monday and Wednesday. The data come from bacteria testing by Heal the Bay staff, supplemented by testing by the City of Los Angeles and Council for Watershed Health as part of the Los Angeles River Watershed Monitoring Program (LARWMP).
Additional agencies now test at recreation sites in the L.A. River through the LARWMP program (Heal the Bay was previously the only group testing the Elysian Valley recreation sites)
L.A. City Sanitation has posted new signs along the L.A. River about water quality that Heal the Bay and L.A. County Department of Public Health recommended
In another positive development, Heal the Bay has recruited some local students to conduct this work.
Under an EPA grant, we’re partnering with Los Angeles Trade Technical College, a public community college in downtown Los Angeles. Five LATTC students have joined our field staff for the summer, to learn the science of water quality monitoring and the art of advocating for environmental protections – starting with the River in their own backyards.
The enthusiasm that these students bring to the River is contagious, and their varied backgrounds and experiences bring broad new perspectives to our watershed work. (You can read more about them here.) The training underscores Heal the Bay’s commitment to diversifying the ranks of environmental science and developing future leaders in our region.
We will highlight their voices and experiences over the rest of the summer through Heal the Bay’s blog and social media channels – check back often to hear what they have to say!
These students have been charged with an important task: identifying where pollution is entering the L.A. River. It’s an important question, not only for people along the banks of the River, but for ocean users as well. The vast majority of pollution at our beaches is carried there via rivermouths and stormdrain outfalls.
To pinpoint these nasty pollution sources, the LATTC students are biking along the L.A. River in the Elysian Valley to identify and sample flowing stormdrains.
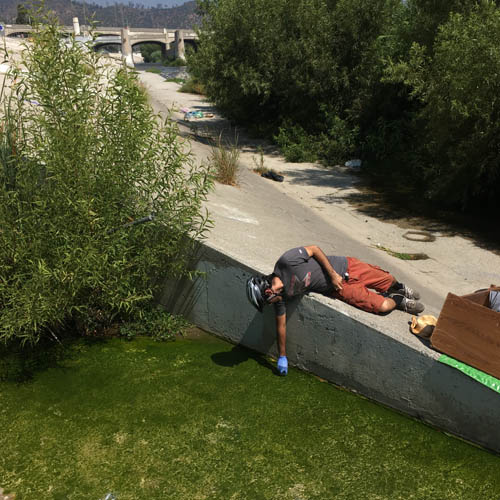
Conducting this monitoring is fascinating – we get important data, and the opportunity to be up-close and personal with the River. Every week we see people using the river for recreational activities like fishing, wading and kayaking but also for basic human needs, such as bathing and washing clothes.
Areas with flowing water provide people and their dogs respite from the oppressive summer heat. They serve homeless encampments as a place to freshen up or bathe. They are also ground zero for the often-polluted urban runoff that harms people, habitat and wildlife in the rivers as well as downstream at the beach.
These are sobering observations, but there is good news too. More people are connecting with nature and discovering their own freshwater oases in urban L.A. And many inland locations have good water quality. Residents are working to protect these special places and keep them healthy and safe.
We encourage you to check back here often, explore your local water bodies, learn about water quality, and learn what you can do to improve the health of your watershed.
If you are thinking about getting out on the water, please check out our FAQ about recreation and water quality issues along the L.A. River.
Heal the Bay’s inaugural study of Los Angeles River microbial water quality that we published July 27, 2016 and last year’s study on swimming holes in the Santa Monica Mountains called for more readily available public water quality information. The public has a right to know about water quality conditions in these freshwater recreation areas so that they can make informed decisions on how to minimize the risk of getting sick.
We will be posting an update every Friday during the summer with water quality information from our weekly sampling of freshwater recreation sites in Los Angeles County.
None of the four criteria exceed the threshold values this week at Rock Pool site in Malibu Creek. The single sample E. coli value was below the threshold of 235 MPN/100ml, and the geometric mean for E. coli was below 126 MPN/100ml. The single sample Enterococcus value was also below the threshold of 110 MPN/100ml as was the geometric mean value for Enterococcus (below 30 MPN/100ml). Since June 15, 2016, we have documented exceedance rates (for single samples) of 20% for E. coli and 13% for Enterococcus at this site.
0 out of 4
None of the four criteria exceed the threshold values this week at Rock Pool site in Malibu Creek. The single sample E. coli value was below the threshold of 235 MPN/100ml, and the geometric mean for E. coli was below 126 MPN/100ml. The single sample Enterococcus value was also below the threshold of 110 MPN/100ml as was the geometric mean value for Enterococcus (below 30 MPN/100ml). Since June 15, 2016, we have documented exceedance rates (for single samples) of 21% for E. coli and 14% for Enterococcus at this site.
0 out of 4
None of the four criteria exceed the threshold values this week at Rock Pool site in Malibu Creek. The single sample E. coli value was below the threshold of 235 MPN/100ml, and the geometric mean for E. coli was below 126 MPN/100ml. The single sample Enterococcus value was also below the threshold of 110 MPN/100ml as was the geometric mean value for Enterococcus (below 30 MPN/100ml). Since June 15, 2016, we have documented exceedance rates (for single samples) of 23% for E. coli and 15% for Enterococcus at this site.
1 out of 4
Only one of the four criteria exceeds the threshold values this week at Rock Pool site in Malibu Creek. The single sample E. coli value was below the threshold of 235 MPN/100ml, and the geometric mean for E. coli was below 126 MPN/100ml. The single sample Enterococcus value was also below the threshold of 110 MPN/100ml but the geometric mean value for Enterococcus was over the threshold of 30 MPN/100ml. Since June 15, 2016, we have documented exceedance rates (for single samples) of 25% for E. coli and 17% for Enterococcus at this site.
1 out of 4
Only one of the four criteria exceeds the threshold values this week at Rock Pool site in Malibu Creek. The single sample E. coli value was below the threshold of 235 MPN/100ml, and the geometric mean for E. coli was below 126 MPN/100ml. The single sample Enterococcus value was also below the threshold of 110 MPN/100ml but the geometric mean value for Enterococcus was over the threshold of 30 MPN/100ml. Since June 15, 2016, we have documented exceedance rates (for single samples) of 27% for E. coli and 18% for Enterococcus at this site.
2 out of 4
Two of the four criteria exceed the threshold values this week at Rock Pool site in Malibu Creek. The single sample E. coli value was below the threshold of 235 MPN/100ml, and the geometric mean for E. coli was below 126 MPN/100ml. In contrast, both the single sample and geometric mean values for Enterococcus were over their respective thresholds. Since June 15, 2016, we have documented exceedance rates (for single samples) of 30% for E. coli and 20% for Enterococcus at this site.
1 out of 4
One of the four criteria exceeds the threshold values this week at Rock Pool site in Malibu Creek. For both E. coli and Enterococcus, the single sample values were under their respective thresholds. The geometric mean value for E. coli was under its threshold, while Enterococcus was over its threshold. Since June 15, 2016, we have documented exceedance rates (for single samples) of 33% for E. coli and 11% for Enterococcus at this site.
2 out of 4
Two of the four criteria exceed the threshold values this week at Rock Pool site in Malibu Creek. For both E. coli and Enterococcus, the single sample values were under their respective thresholds but the geometric mean values were over the thresholds. Since June 15, 2016, we have documented exceedance rates (for single samples) of 33% for E. coli and 12% for Enterococcus at this site.
3 out of 4
Three of the four criteria exceed the threshold values this week at Rock Pool site in Malibu Creek. For E. coli, the single sample and geometric mean values were over threshold values; the single sample Enterococcus value was under the threshold of 110 MPN/100ml but the geometric mean value was over the threshold value. Since June 15, 2016, we have documented exceedance rates (for single samples) of 43% for E. coli and 14% for Enterococcus at this site.
Las Virgenes Creek at the Bridge
1 out of 4
Only one of the four criteria exceed the threshold values this week at Las Virgenes Creek at the bridge. The single sample E. coli value was below the threshold of 235 MPN/100ml, and the geometric mean for E. coli was below 126 MPN/100ml. The single sample Enterococcus value was also below the threshold of 110 MPN/100ml but the geometric mean value for Enterococcus was over the threshold of 30 MPN/100ml. Since June 15, 2016, we have documented exceedance rates (for single samples) of 27% for E. coli and 53% for Enterococcus at this site.
3 out of 4
Three of the four criteria exceed the threshold values this week at Las Virgenes Creek at the bridge. The single sample E. coli value was below the threshold of 235 MPN/100ml but the geometric mean value for E. coli was over the threshold of 126 MPN/100ml.The single sample Enterococcus value was over the threshold of 110 MPN/100ml and the geometric mean value for Enterococcus was over the threshold of 30 MPN/100ml. Since June 15, 2016, we have documented exceedance rates (for single samples) of 29% for E. coli and 57% for Enterococcus at this site.
2 out of 4
Two of the four criteria exceed the threshold values this week at Las Virgenes Creek at the bridge. The single sample E. coli value was below the threshold of 235 MPN/100ml but the geometric mean value for E. coli was over the threshold of 126 MPN/100ml.The single sample Enterococcus value was below the threshold of 110 MPN/100ml but the geometric mean value for Enterococcus was over the threshold of 30 MPN/100ml. Since June 15, 2016, we have documented exceedance rates (for single samples) of 31% for E. coli and 54% for Enterococcus at this site.
2 out of 4
Two of the four criteria exceed the threshold values this week at Las Virgenes Creek at the bridge. The single sample E. coli value was below the threshold of 235 MPN/100ml but the geometric mean value for E. coli was over the threshold of 126 MPN/100ml.The single sample Enterococcus value was below the threshold of 110 MPN/100ml but the geometric mean value for Enterococcus was over the threshold of 30 MPN/100ml. Since June 15, 2016, we have documented exceedance rates (for single samples) of 33% for E. coli and 58% for Enterococcus at this site.
3 out of 4
Three of the four criteria exceed the threshold values this week at Las Virgenes Creek at the bridge. The single sample and geometric mean values for E. coli value were both over their respective thresholds of 235 MPN/100ml and 126 MPN/100ml. The single sample Enterococcus value was below the threshold of 110 MPN/100ml but the geometric mean value for Enterococcus was over the threshold of 30 MPN/100ml. Since June 15, 2016, we have documented exceedance rates (for single samples) of 36% for E. coli and 64% for Enterococcus at this site.
3 out of 4
Three of the four criteria exceed the threshold values this week at Las Virgenes Creek at the bridge. The single sample E. coli value was below the threshold of 235 MPN/100ml, while the geometric mean for E. coli was over 126 MPN/100ml. Both the single sample and geometric mean values for Enterococcus were over their respective thresholds. Since June 15, 2016, we have documented exceedance rates (for single samples) of 30% for E. coli and 70% for Enterococcus at this site.
4 out of 4
Four of the four criteria exceed the threshold values this week at Las Virgenes Creek at the bridge. The single sample E. coli value was above the threshold of 235 MPN/100ml, and the geometric mean for E. coli was over 126 MPN/100ml. Similarly, both the single sample and geometric mean values for Enterococcus were over their respective thresholds. Since June 15, 2016, we have documented exceedance rates (for single samples) of 33% for E. coli and 67% for Enterococcus at this site.
3 out of 4
Three of the four criteria exceed the threshold values this week at Las Virgenes Creek at the bridge. The single sample E. coli value was below the threshold of 235 MPN/100ml but the geometric mean for E. coli was over 126 MPN/100ml, and both the single sample and geometric mean values for Enterococcus were over their respective thresholds. Since June 15, 2016, we have documented exceedance rates (for single samples) of 25% for E. coli and 62% for Enterococcus at this site.
3 out of 4
Three of the four criteria exceed the threshold values this week at Las Virgenes Creek at the bridge. The single sample E. coli value was below the threshold of 235 MPN/100ml but the geometric mean for E. coli was over 126 MPN/100ml, and both the single sample and geometric mean values for Enterococcus were over their respective thresholds. Since June 15, 2016, we have documented exceedance rates (for single samples) of 29% for E. coli and 57% for Enterococcus at this site.
Only one of the four criteria exceeds the threshold values this week at the Steelhead Park site for the Los Angeles River. The single sample E. coli value was below the threshold of 235 MPN/100ml, and the geometric mean for E. coli was below 126 MPN/100ml. The single sample Enterococcus value was also below the threshold of 110 MPN/100ml but the geometric mean value for Enterococcus was over the threshold of 30 MPN/100ml. Since May 31, 2016, we have documented exceedance rates (for single samples) of 6% for E. coli and 61% for Enterococcus at this site.
1 out of 4
Only one of the four criteria exceeds the threshold values this week at the Steelhead Park site for the Los Angeles River. The single sample E. coli value was below the threshold of 235 MPN/100ml, and the geometric mean for E. coli was below 126 MPN/100ml. The single sample Enterococcus value was also below the threshold of 110 MPN/100ml but the geometric mean value for Enterococcus was over the threshold of 30 MPN/100ml. Since May 31, 2016, we have documented exceedance rates (for single samples) of 6% for E. coli and 65% for Enterococcus at this site.
1 out of 4
Only one of the four criteria exceeds the threshold values this week at the Steelhead Park site for the Los Angeles River. The single sample E. coli value was below the threshold of 235 MPN/100ml, and the geometric mean for E. coli was below 126 MPN/100ml. The single sample Enterococcus value was also below the threshold of 110 MPN/100ml but the geometric mean value for Enterococcus was over the threshold of 30 MPN/100ml. Since May 31, 2016, we have documented exceedance rates (for single samples) of 6% for E. coli and 69% for Enterococcus at this site.
1 out of 4
Only one of the four criteria exceeds the threshold values this week at the Steelhead Park site for the Los Angeles River. The single sample E. coli value was below the threshold of 235 MPN/100ml, and the geometric mean for E. coli was below 126 MPN/100ml. The single sample Enterococcus value was also below the threshold of 110 MPN/100ml but the geometric mean value for Enterococcus was over the threshold of 30 MPN/100ml. Since May 31, 2016, we have documented exceedance rates (for single samples) of 7% for E. coli and 73% for Enterococcus at this site.
2 out of 4
Two of the four criteria exceed the threshold values this week at the Steelhead Park site for the Los Angeles River. The single sample E. coli value was below the threshold of 235 MPN/100ml, and the geometric mean for E. coli was below 126 MPN/100ml. In contrast, both the single sample and geometric mean values for Enterococcus were over their respective thresholds (110 and 30 MPN/100ml). Since May 31, 2016, we have documented exceedance rates (for single samples) of 7% for E. coli and 79% for Enterococcus at this site.
2 out of 4
Two of the four criteria exceed the threshold values this week at the Steelhead Park site for the Los Angeles River. The single sample E. coli value was below the threshold of 235 MPN/100ml, and the geometric mean for E. coli was below 126 MPN/100ml. In contrast, both the single sample and geometric mean values for Enterococcus were over their respective thresholds. Since May 31, 2016, we have documented exceedance rates (for single samples) of 8% for E. coli and 77% for Enterococcus at this site.
Rattlesnake Park, Elysian Valley
3 out of 4
Three of the four criteria exceed the threshold values this week at the Rattlesnake Park site for the Los Angeles River. The single sample value for E. coli was below the threshold of 235 MPN/100ml, but the geometric mean for E. coli was over the threshold of 126 MPN/100ml. Both the single sample and geometric mean values for Enterococcus were also over their respective thresholds (110 and 30 MPN/100ml). Since May 31, 2016, we have documented exceedance rates (for single samples) of 50% for E. coli and 100% for Enterococcus at this site.
4 out of 4
All four of the criteria exceed the threshold values this week at the Rattlesnake Park site for the Los Angeles River. The single sample and geometric mean values for E. coli value were above the thresholds of 235 and 126 MPN/100ml, respectively. Both the single sample and geometric mean values for Enterococcus were also over their respective thresholds (110 and 30 MPN/100ml). Since May 31, 2016, we have documented exceedance rates (for single samples) of 53% for E. coli and 100% for Enterococcus at this site.
4 out of 4
All four of the criteria exceed the threshold values this week at the Rattlesnake Park site for the Los Angeles River. The single sample and geometric mean values for E. coli value were above the thresholds of 235 and 126 MPN/100ml, respectively. Both the single sample and geometric mean values for Enterococcus were also over their respective thresholds (110 and 30 MPN/100ml). Since May 31, 2016, we have documented exceedance rates (for single samples) of 50% for E. coli and 100% for Enterococcus at this site.
3 out of 4
Three of the four criteria exceed the threshold values this week at the Rattlesnake Park site for the Los Angeles River. The single sample E. coli value was below the threshold of 235 MPN/100ml, but the geometric mean for E. coli was over 126 MPN/100ml. Both the single sample and geometric mean values for Enterococcus were over their respective thresholds (110 and 30 MPN/100ml). Since May 31, 2016, we have documented exceedance rates (for single samples) of 47% for E. coli and 100% for Enterococcus at this site.
3 out of 4
Three of the four criteria exceed the threshold values this week at the Rattlesnake Park site for the Los Angeles River. The single sample E. coli value was below the threshold of 235 MPN/100ml, but the geometric mean for E. coli was over 126 MPN/100ml. Both the single sample and geometric mean values for Enterococcus were over their respective thresholds (110 and 30 MPN/100ml). Since May 31, 2016, we have documented exceedance rates (for single samples) of 50% for E. coli and 100% for Enterococcus at this site.
4 out of 4
Four of the four criteria exceed the threshold values this week at the Rattlesnake Park site for the Los Angeles River. The single sample E. coli value was above the threshold of 235 MPN/100ml, and the geometric mean for E. coli was over 126 MPN/100ml. Similarly, both the single sample and geometric mean values for Enterococcus were over their respective thresholds. Since May 31, 2016, we have documented exceedance rates (for single samples) of 54% for E. coli and 100% for Enterococcus at this site.
Sepulveda Basin at Burbank Blvd.
1 out of 4
Only one of the four criteria exceeds the threshold values this week at the Sepulveda Basin site for the Los Angeles River. The single sample E. coli value was below the threshold of 235 MPN/100ml, and the geometric mean for E. coli was below 126 MPN/100ml. The single sample Enterococcus value was also below the threshold of 110 MPN/100ml but the geometric mean value for Enterococcus was over the threshold of 30 MPN/100ml. Since May 31, 2016, we have documented exceedance rates (for single samples) of 0% for E. coli and 6% for Enterococcus at this site.
1 out of 4
Only one of the four criteria exceeds the threshold values this week at the Sepulveda Basin site for the Los Angeles River. The single sample E. coli value was below the threshold of 235 MPN/100ml, and the geometric mean for E. coli was below 126 MPN/100ml. The single sample Enterococcus value was also below the threshold of 110 MPN/100ml but the geometric mean value for Enterococcus was over the threshold of 30 MPN/100ml. Since May 31, 2016, we have documented exceedance rates (for single samples) of 0% for E. coli and 7% for Enterococcus at this site.
2 out of 4
Two of the four criteria exceed the threshold values this week at the Sepulveda Basin site for the Los Angeles River. The single sample E. coli value was below the threshold of 235 MPN/100ml, and the geometric mean for E. coli was below 126 MPN/100ml. In contrast, both the single sample and geometric mean values for Enterococcus were over their respective thresholds. Since May 31, 2016, we have documented exceedance rates (for single samples) of 0% for E. coli and 8% for Enterococcus at this site.
We envision safe swimmable rivers and creeks throughout Los Angeles County. However, a number of recreational waterbodies are not regularly monitored or monitored at all. We know thousands of Angelenos use these aquatic resources.
As such, Heal the Bay would rather provide some information about the water quality they are immersing themselves into rather than no information. The idea is to prompt the user to ask questions about these waterbodies: What is the origin of the water? Can I get sick from it? What types of illnesses can I get? How do I get more information? Check out the answers to these questions and more in our FAQ and the joint statement on recreation in the L.A. River.
Heal the Bay has been monitoring water quality in streams and rivers since 1998 through our Stream Team program. In 2014 we initiated a pilot study to monitor human use and water quality at freshwater swimming spots in the Santa Monica Mountains, focusing on bacterial pollution and public health implications. We are currently in our third summer of monitoring water quality in those swimming locations. Given Heal the Bay’s 25-year history of informing and educating beachgoers about beach water quality through our Beach Report Card, assessing the water quality of the Los Angeles River recreation zones was a natural next step. We are now in our second season of monitoring for the L.A. River recreation zones.
The A-to-F grading system of the Beach Report Card took years of work to develop and fine-tune. We are only in the very early stages of thinking about an analogous River Report Card. But we want to start by making basic water quality information available to the public in a timely manner.
We will be providing weekly information about levels of fecal indicator bacteria at five sites. We will report on whether the sample from the current week exceeded limits set by the Regional Water Quality Control Board and US EPA and what the microbial water quality has been over the summer sampling season thus far.
We will report on two types of fecal indicator bacteria, or FIB: E. coli and Enterococcus. FIB, while not harmful themselves, indicate the possible presence of pathogenic bacteria, which have been found to cause ear infections, skin rashes, respiratory illnesses and gastrointestinal illness. High levels of FIB are particularly concerning in areas where people come in contact with water through activities like swimming, fishing, and kayaking.
Excuse us for getting technical in this next section, but we just want to be clear about what we are measuring and what constitutes an exceedance.
The freshwater regulatory limit for E. coli is set in the TMDL at 235 MPN/100ml for a single sample and 126 MPN/100ml for the geometric mean. (A geometric mean is a type of average that results in a number that is not as heavily affected by very high or very low values).
We calculate geometric means from all samples over the last 30-day period (usually four or five samples). For Enterococcus, we used EPA’s statistical threshold value for an illness rate of 32/1,000 (the more protective rate), which is 110 MPN/100ml for a single sample and 30 MPN/100ml for the geometric mean in a fresh waterbody designated for recreation.
For each site, we will report on the number of criteria that exceeded four standards. A site can have 0-4 out of four exceedances. A sample exceeds if:
E. coli single sample > 235 MPN/100ml
E. coli geometric mean > 126 MPN/100ml
Enterococcus single sample is > 110 MPN/100ml
Enterococcus geometric mean is > 30 MPN/100ml
So, what does that all mean?
The greater the number and magnitude of exceedances at a site, the worse the water quality is, indicating a potentially increased risk of getting sick.
Deciding what to do with this information depends on the risk level you are comfortable with. Single sample values give you an indication of the most recent water quality, while geometric mean values give you an indication of the ambient water quality over the last 30 days.
However, it is important to note that the single sample gives information for the day on which the sample was taken and conditions can change throughout the week until the next sample is taken.
The thresholds that the US EPA and the RWQCB have put forth are based on epidemiological studies and risk. An increased risk of illness is not a guarantee that you will get sick. Certain activities are more risky when water quality is poor; for instance, swimming and submerging your head is more risky than wading; swimming is more risky than kayaking; kayaking is likely more risky than hiking (at least with regards to picking up a waterborne illness), and so on, with the risk dependent on how likely you are to ingest or contact water.
We recommend following these best practices to stay safe and healthy.
Swimming: In waters known to exceed bacterial limits, swimming is not recommended, particularly submerging one’s head. Elevated bacteria levels can occur at any time. Swimmers should use caution when entering the water by checking the latest water quality results, avoiding contact immediately after a rainfall, if they are immunocompromised, or if they have an open wound. If there is any water contact, then rise off with soap and water afterward.
Kayaking and Fishing: In waters that are known to exceed bacterial limits, people should limit water contact, especially avoiding hand-to-face water contact. Users should not enter the water with an open wound, if immunocompromised, or after a rainfall. If there is any water contact, then rinse off with soap and water afterward.
Aug, 5, 2016 — Staff scientist Katherine Pease launches our Freshwater Friday blog post, providing weekly updates on the latest bacterial exceedances at popular recreational zones
Heal the Bay’s inaugural study of Los Angeles River microbial water quality that we published last week and last year’s study on swimming holes in the Santa Monica Mountains called for more readily available public water quality information. The public has a right to know about water quality conditions in these freshwater recreation areas so that they can make informed decisions on how to minimize the risk of getting sick.
So beginning today with our Santa Monica Mountains sites, we will be posting a blog post every Friday during the summer with water quality information from our weekly sampling of freshwater recreation sites in Los Angeles County. (You can see this week’s findings at the bottom of this page, but first we want to explain our intent and methodology.)
We envision safe swimmable rivers and creeks throughout Los Angeles County. However, a number of recreational waterbodies are not regularly monitored or monitored at all. We know thousands of Angelenos use these aquatic resources.
As such, Heal the Bay would rather provide some information about the water quality they are immersing themselves into rather than no information. The idea is to prompt the user to ask questions about these waterbodies: What is the origin of the water? Can I get sick from it? What types of illnesses can I get? How do I get more information? We will be posting a Frequently Asked Questions document next week to help answer some of these questions.
Heal the Bay has been monitoring water quality in streams and rivers since 1998 through our Stream Team program. In 2014 we initiated a pilot study to monitor human use and water quality at freshwater swimming spots in the Santa Monica Mountains, focusing on bacterial pollution and public health implications.
The A-to-F grading system of the Beach Report Card took years of work to develop and fine-tune. We are only in the very early stages of thinking about an analogous River Report Card. But we want to start by making basic water quality information available to the public in a timely manner.
We will be providing weekly information about levels of fecal indicator bacteria at five sites. We will report on whether the sample from the current week exceeded limits set by the Regional Water Quality Control Board and US EPA and what the microbial water quality has been over the summer sampling season thus far.
We will report on two types of fecal indicator bacteria, or FIB: E. coli and Enterococcus. FIB, while not harmful themselves, indicate the possible presence of pathogenic bacteria, which have been found to cause ear infections, skin rashes, respiratory illnesses and gastrointestinal illness. High levels of FIB are particularly concerning in areas where people come in contact with water through activities like swimming, fishing, and kayaking.
Excuse us for getting technical in this next section, but we just want to be clear about what we are measuring and what constitutes an exceedance.
The freshwater regulatory limit for E. coli is set in the TMDL at 235 MPN/100ml for a single sample and 126 MPN/100ml for the geometric mean. (A geometric mean is a type of average that results in a number that is not as heavily affected by very high or very low values).
We calculate geometric means from all samples over the last 30-day period (usually four or five samples). For Enterococcus, we used EPA’s statistical threshold value (for an illness rate of 32/1,000 (the more protective rate), which is 110 MPN/100ml for a single sample and 30 MPN/100ml for the geometric mean in a fresh waterbody designated for recreation.
For each site, we will report on the number of criteria that exceeded four standards. A site can have 0-4 out of four exceedances. A sample exceeds if:
E. coli single sample > 235 MPN/100ml
E. coli geometric mean > 126 MPN/100ml
Enterococcus single sample is > 110 MPN/100ml
Enterococcus geometric mean is > 30 MPN/100ml
So, what does that all mean?
The greater the number and magnitude of exceedances at a site, the worse the water quality is, indicating a potentially increased risk of getting sick.
Deciding what to do with this information depends on the risk level you are comfortable with. Single sample values give you an indication of the most recent water quality, while geometric mean values give you an indication of the ambient water quality over the last 30 days.
However, it is important to note that the single sample gives information for the day on which the sample was taken and conditions can change throughout the week until the next sample is taken.
The thresholds that the US EPA and the RWQCB have put forth are based on epidemiological studies and risk. An increased risk of illness is not a guarantee that you will get sick. Certain activities are more risky when water quality is poor; for instance, swimming and submerging your head is more risky than wading; swimming is more risky than kayaking; kayaking is likely more risky than hiking (at least with regards to picking up a waterborne illness), and so on, with the risk dependent on how likely you are to ingest or contact water.
We recommend following these best practices to stay safe and healthy.
Swimming: In waters known to exceed bacterial limits, swimming is not recommended, particularly submerging one’s head. Elevated bacteria levels can occur at any time. Swimmers should use caution when entering the water by checking the latest water quality results, avoiding contact immediately after a rainfall, if they are immunocompromised, or if they have an open wound. If there is any water contact, then rise off with soap and water afterward.
Kayaking and Fishing: In waters that are known to exceed bacterial limits, people should limit water contact, especially avoiding hand-to-face water contact. Users should not enter the water with an open wound, if immunocompromised, or after a rainfall. If there is any water contact, then rinse off with soap and water afterward.
Malibu Creek State Park
for the week ending August 3, 2016
1. Rock Pool: Three exceedances
Three of the four criteria exceed the threshold values this week at Rock Pool site in Malibu Creek. For E. coli, the single sample and geometric mean values were over threshold values; the single sample Enterococcus value was under the threshold of 110 MPN/100ml but the geometric mean value was over the threshold value. Since June 15, 2016, we have documented exceedance rates (for single samples) of 43% for E. coli and 14% for Enterococcus at this site.
2. Las Virgenes Creek at the bridge: Three exceedances
Three of the four criteria exceed the threshold values this week at Las Virgenes Creek at the bridge. The single sample E. coli value was below the threshold of 235 MPN/100ml but the geometric mean for E. coli was over 126 MPN/100ml, and both the single sample and geometric mean values for Enterococcus were over their respective thresholds. Since June 15, 2016, we have documented exceedance rates (for single samples) of 29% for E. coli and 57% for Enterococcus at this site.
Less than 10% of all plastic ever produced has been recycled.
This Plastic-Free July, Reuse Is a Right. Learn why expanding reusable systems is key to reducing plastic pollution, then take action by signing our petition urging LA leaders to support a reusable future for Los Angeles.

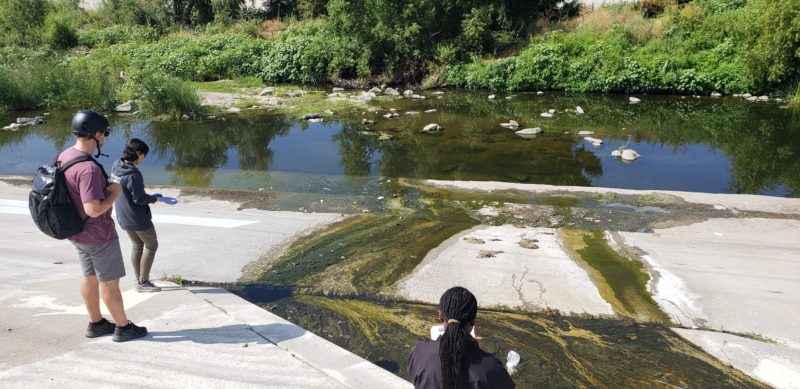


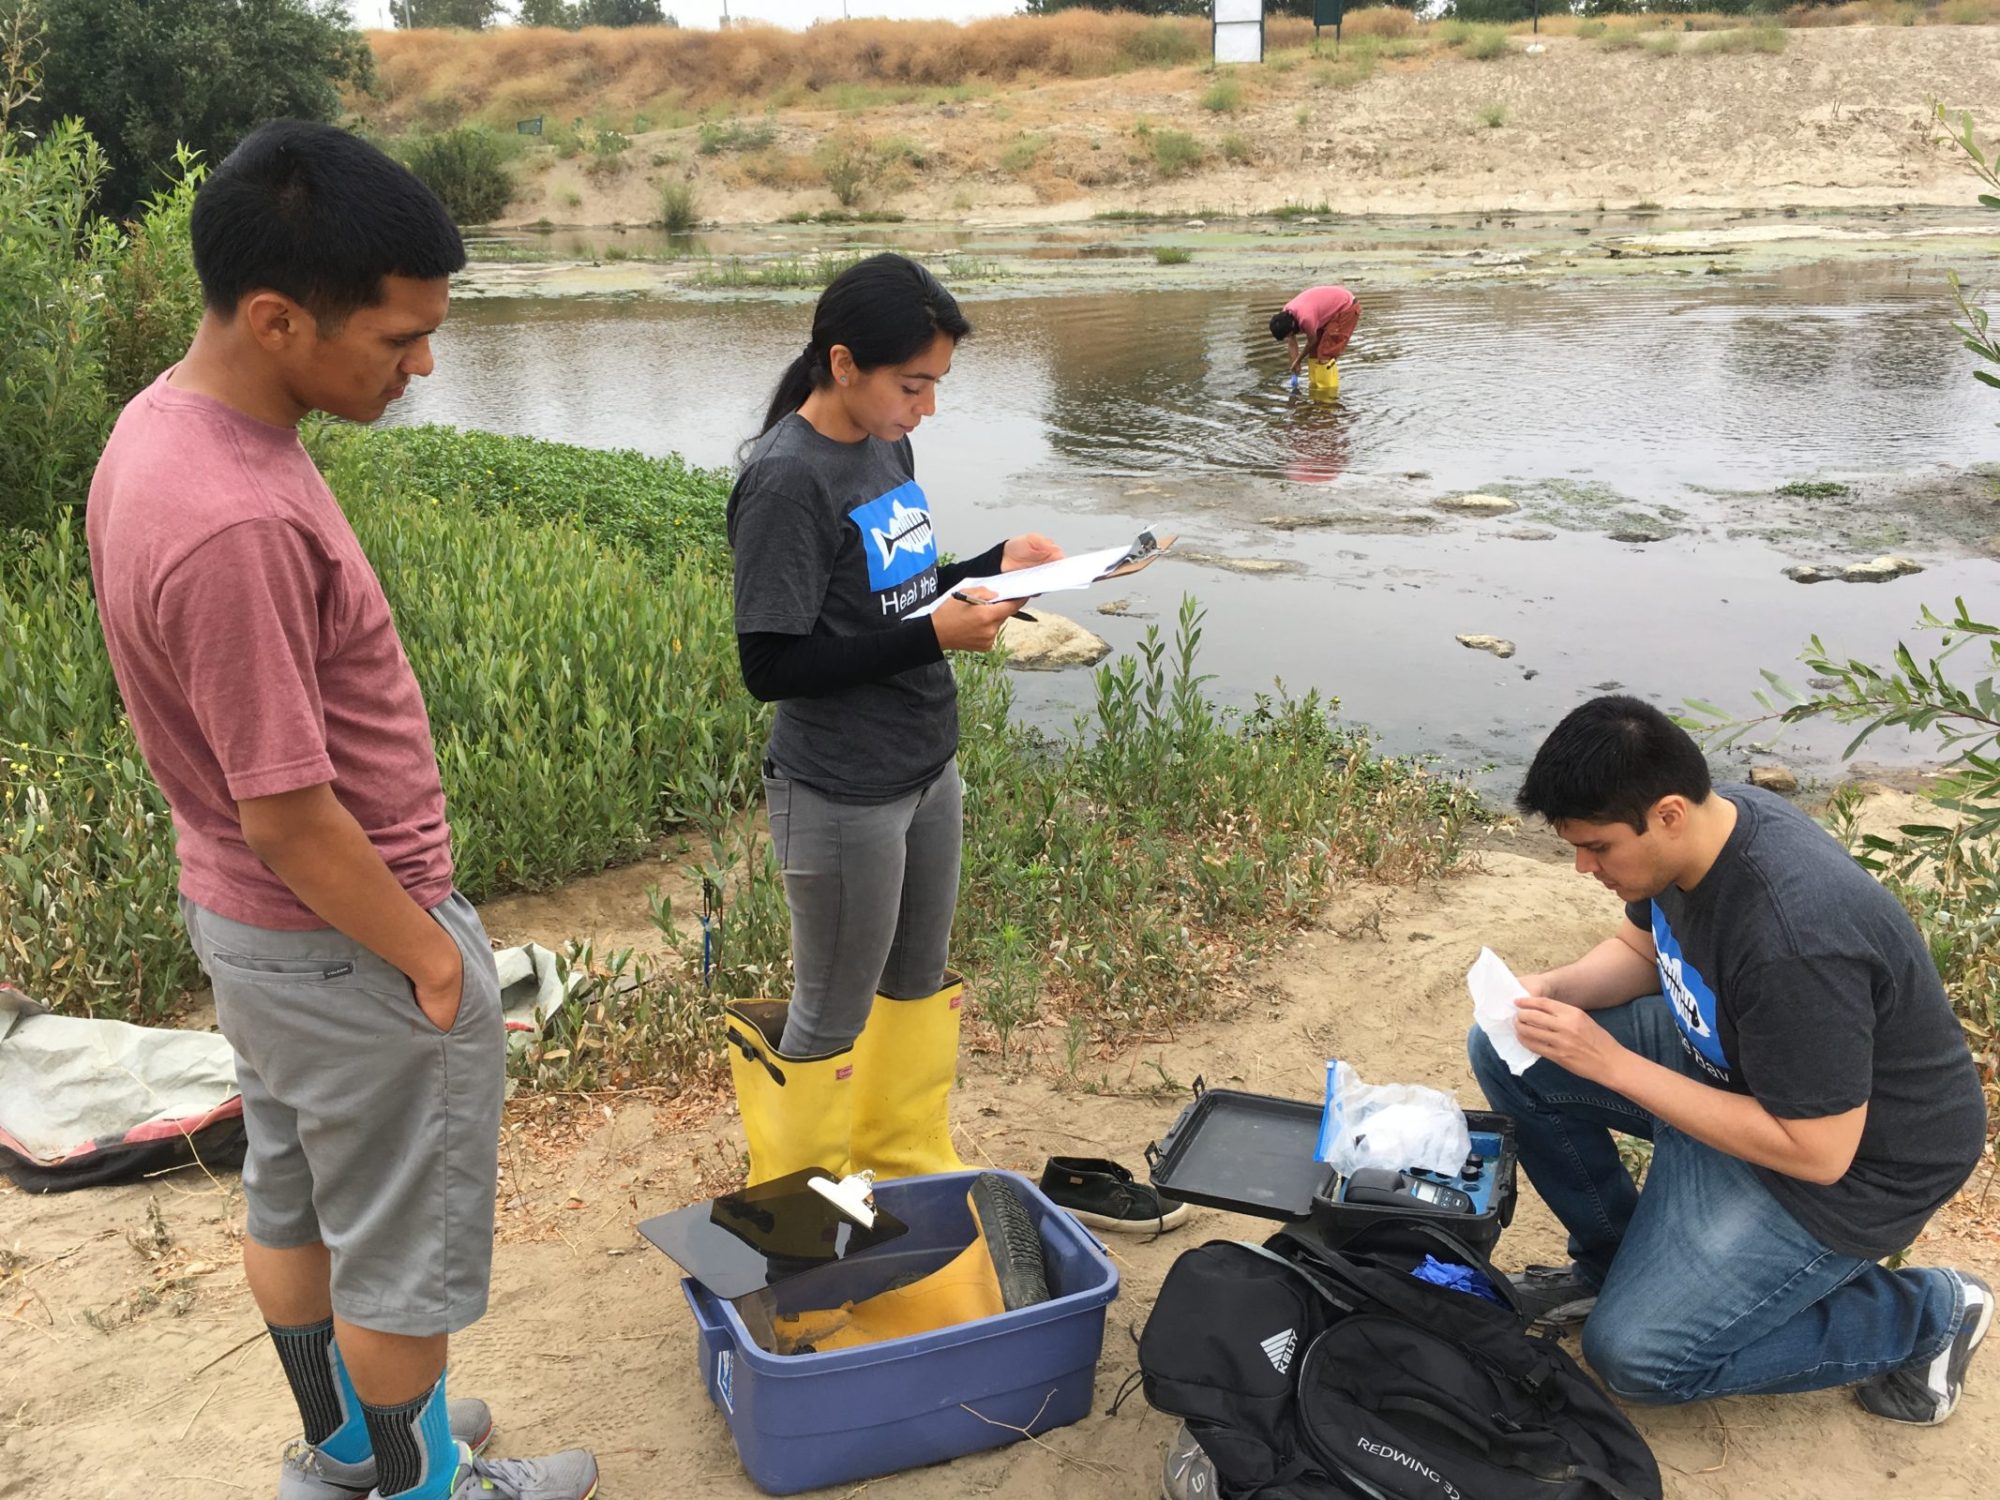 Las áreas acuáticas para nado y recreación en el condado de Los Angeles brindan oportunidades importantes para quienes disfrutan y valoran la naturaleza de nuestros ríos y arroyos. Desafortunadamente, existe poca información o notificación pública de la calidad del agua por parte del estado. Como resultado, carecemos de datos estandarizados y la información disponible para el público es mínima y difícil de interpretar.
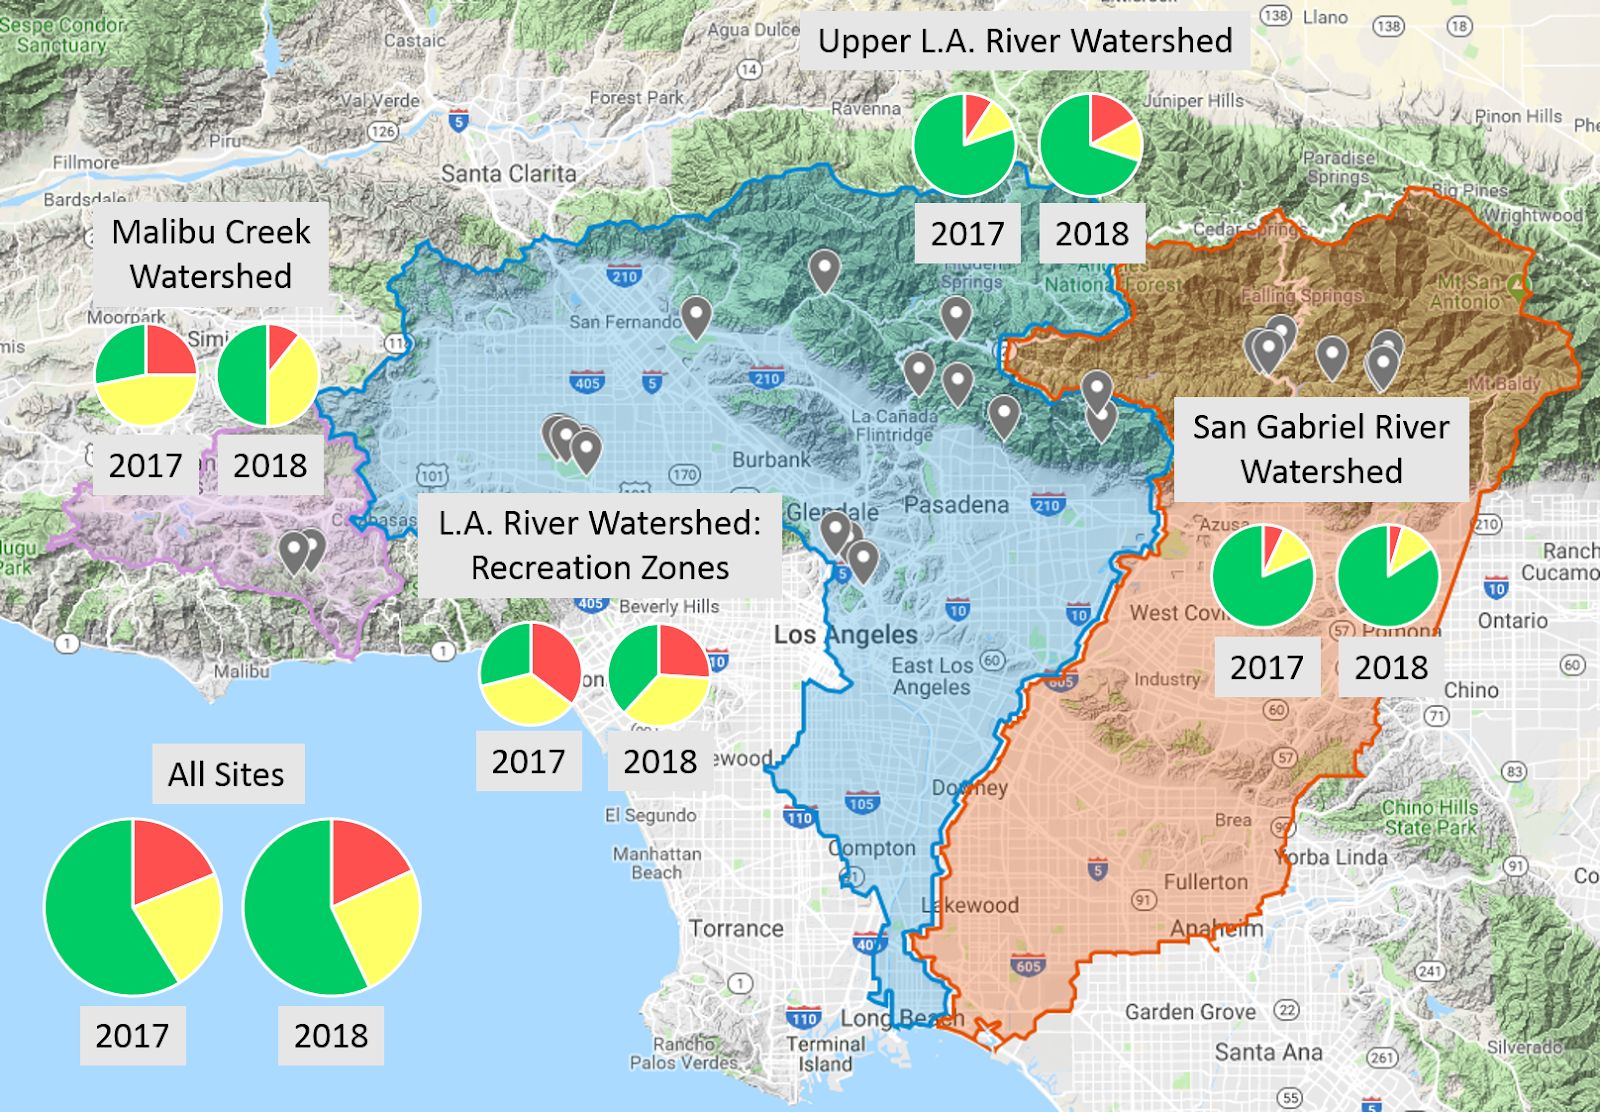
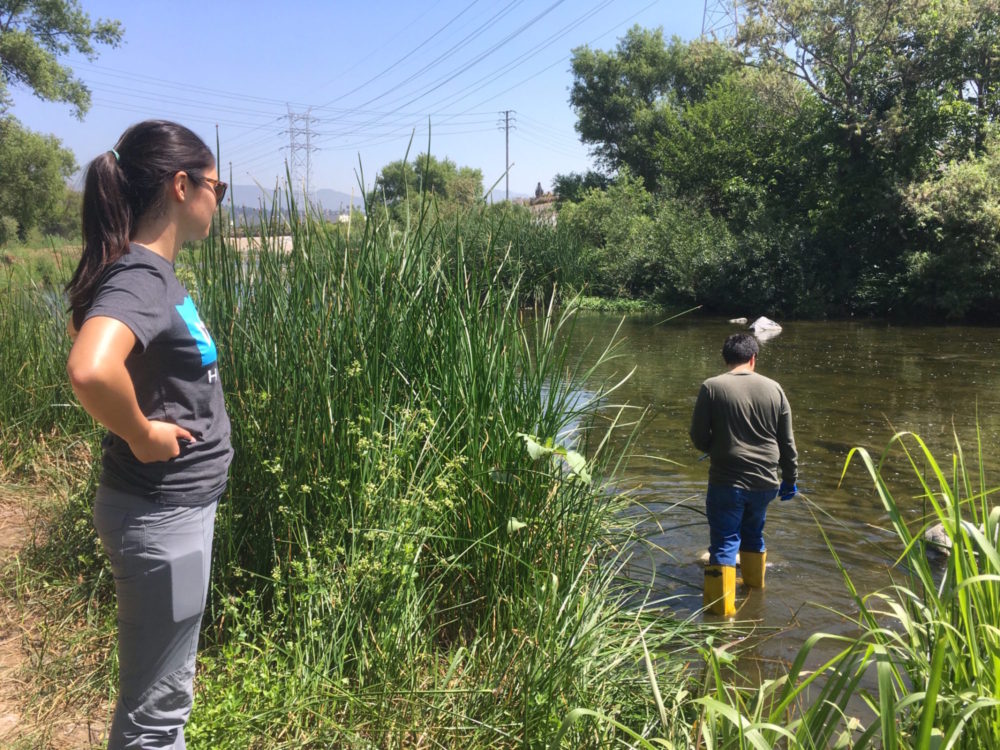
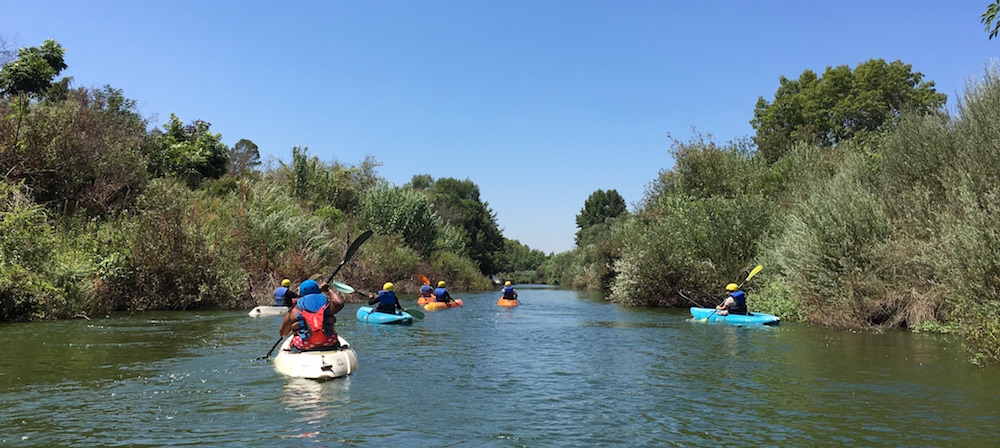 Tips for enjoying and staying safe in L.A.’s rivers, streams, and creeks
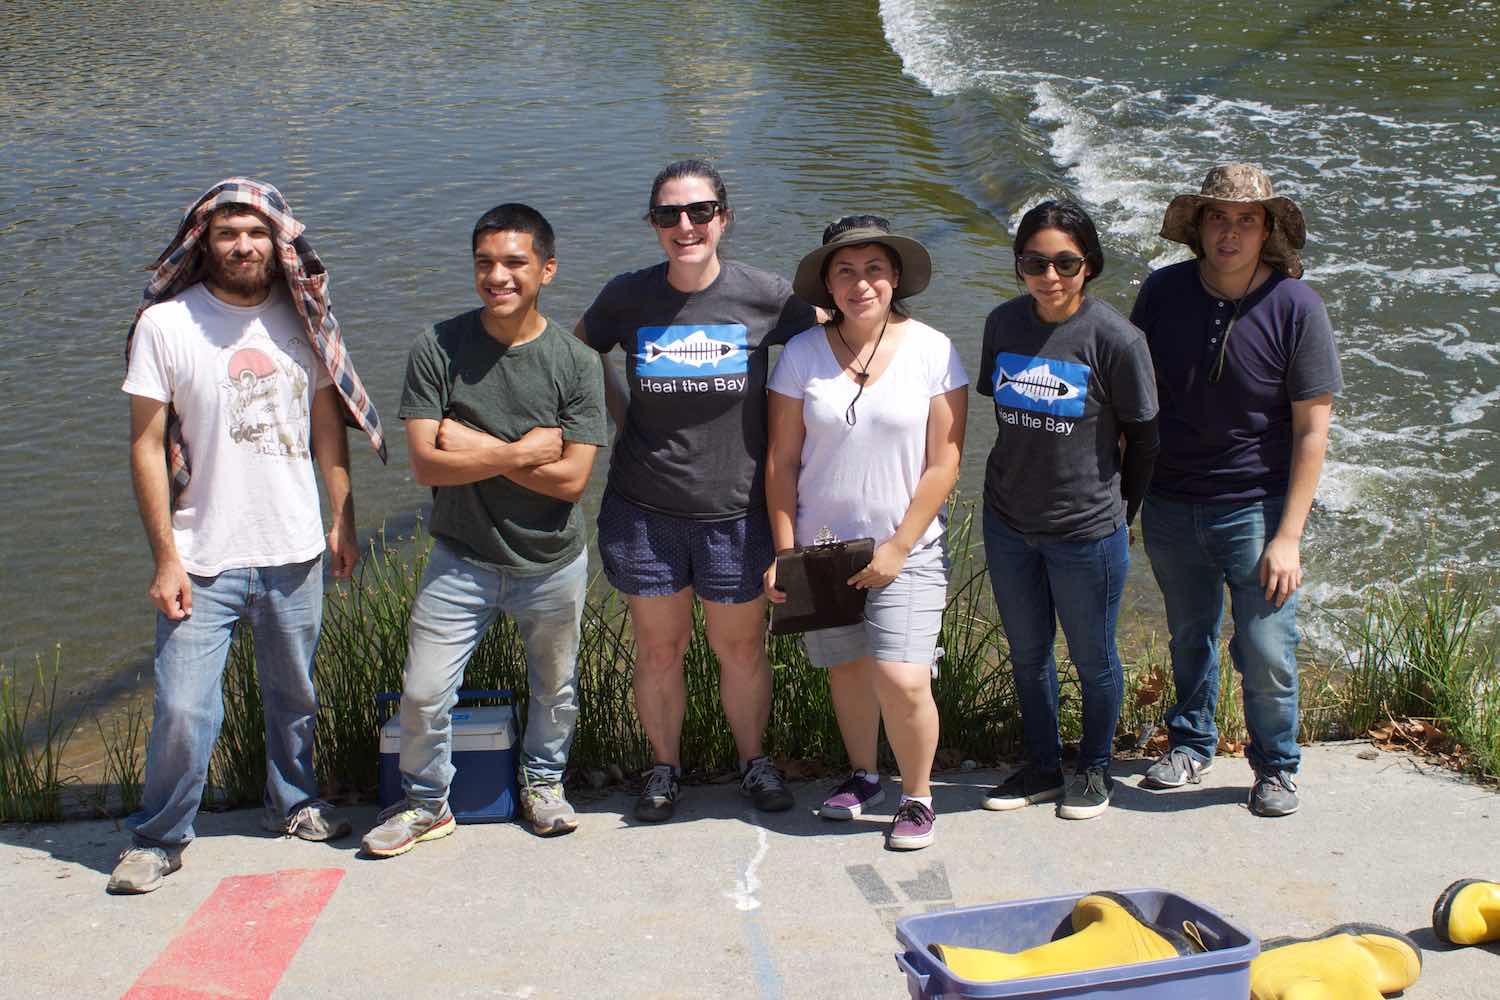
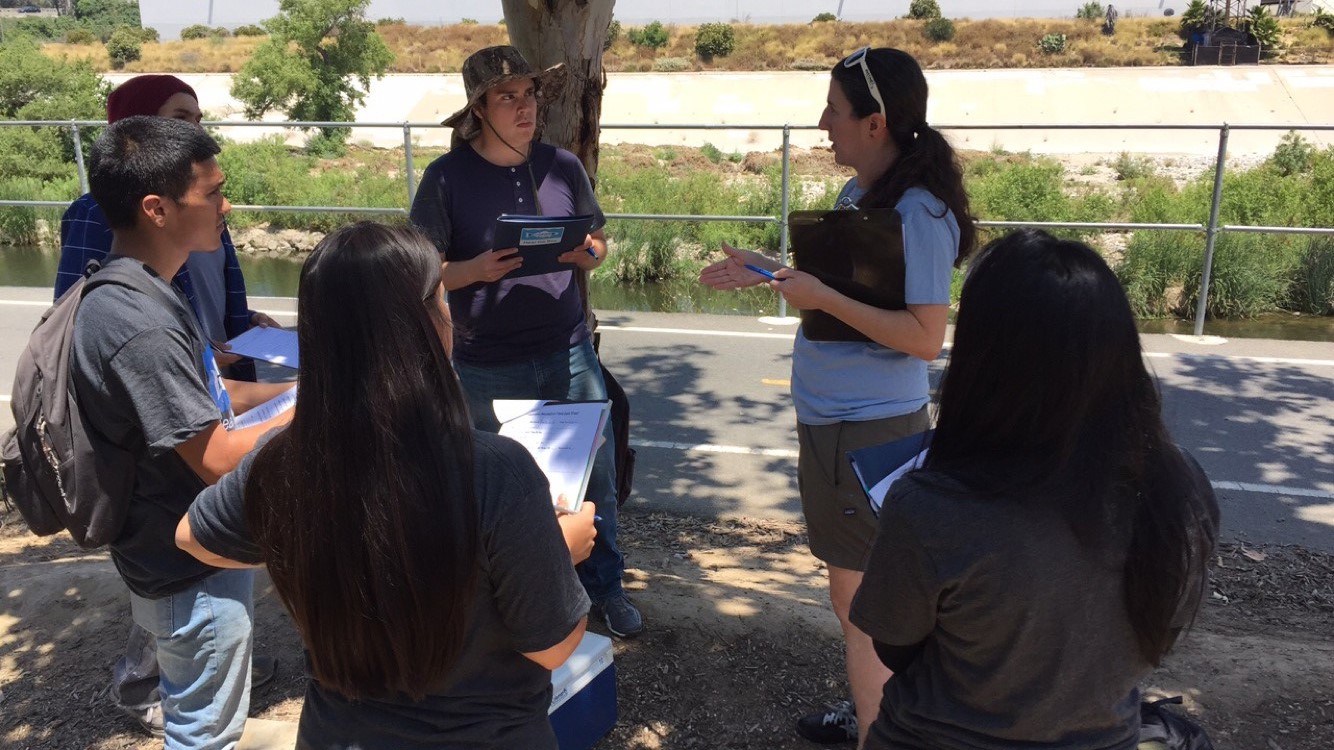
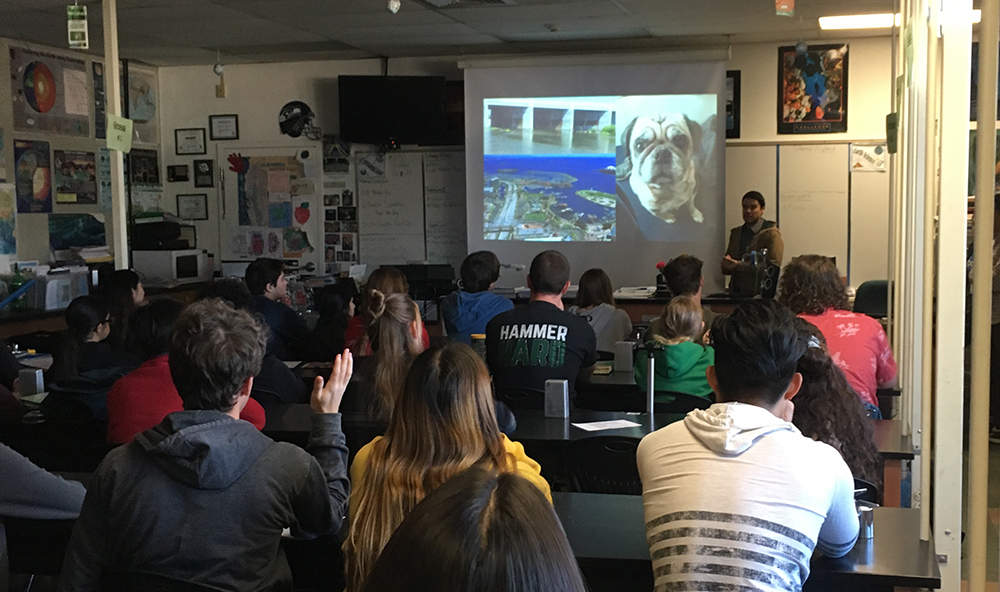
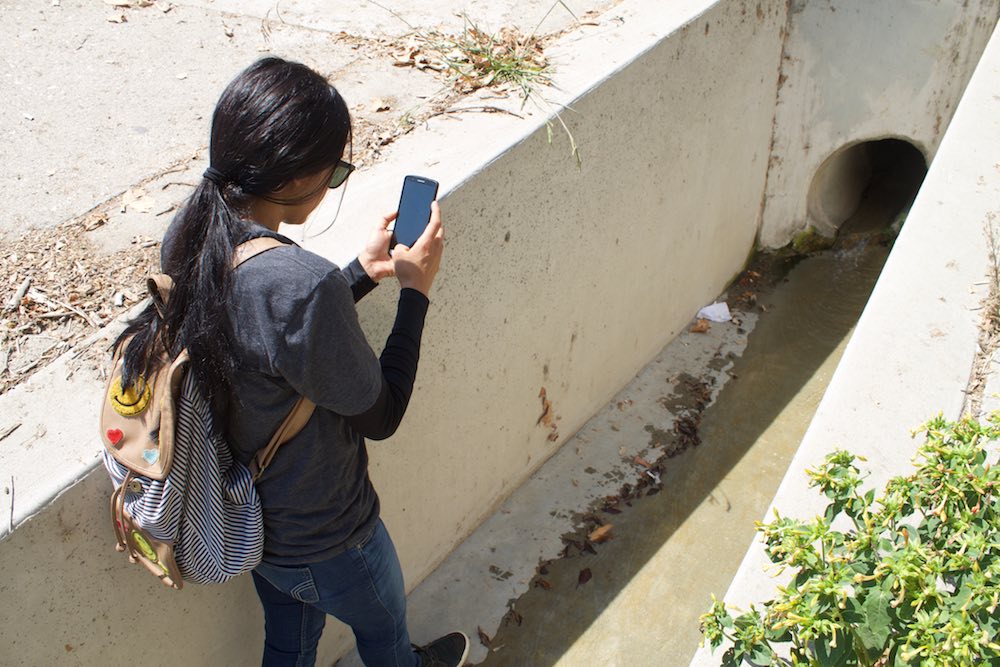
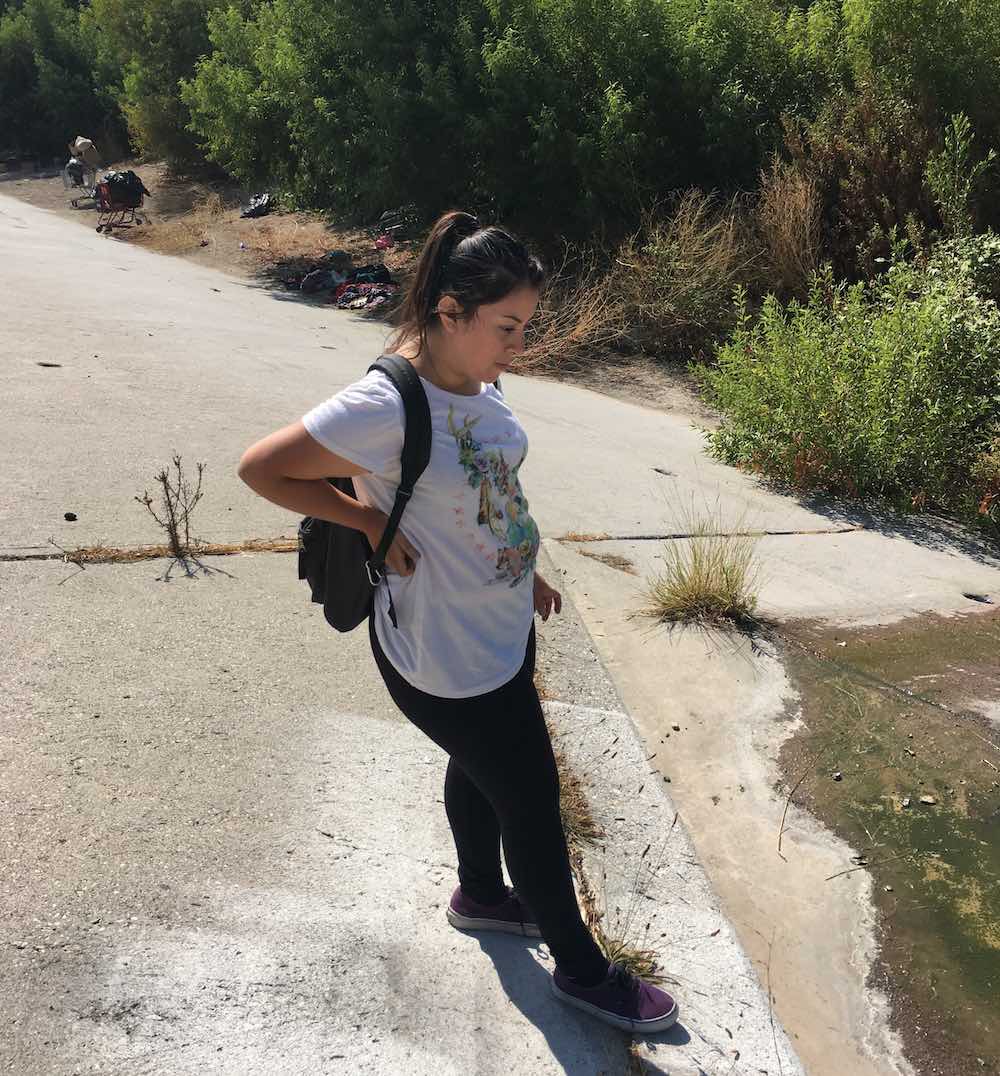
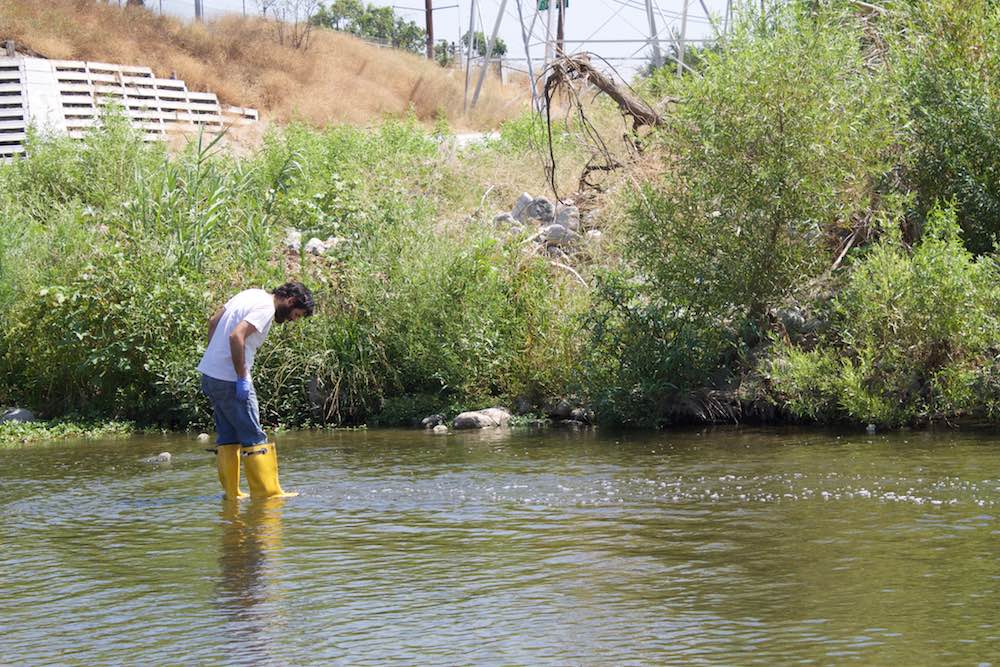
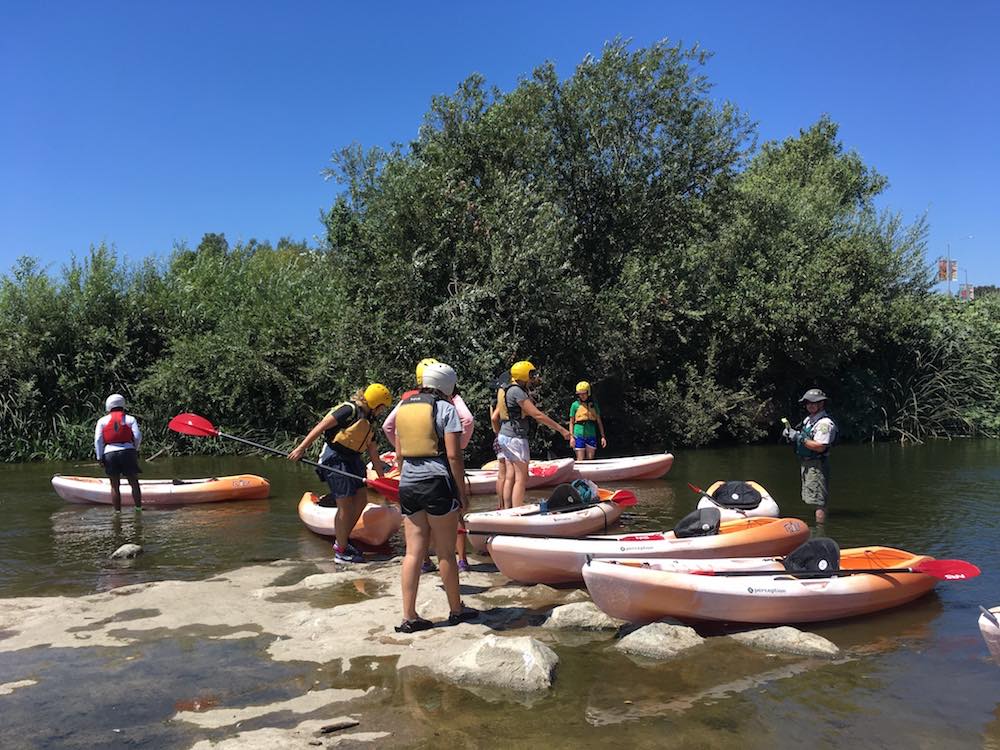
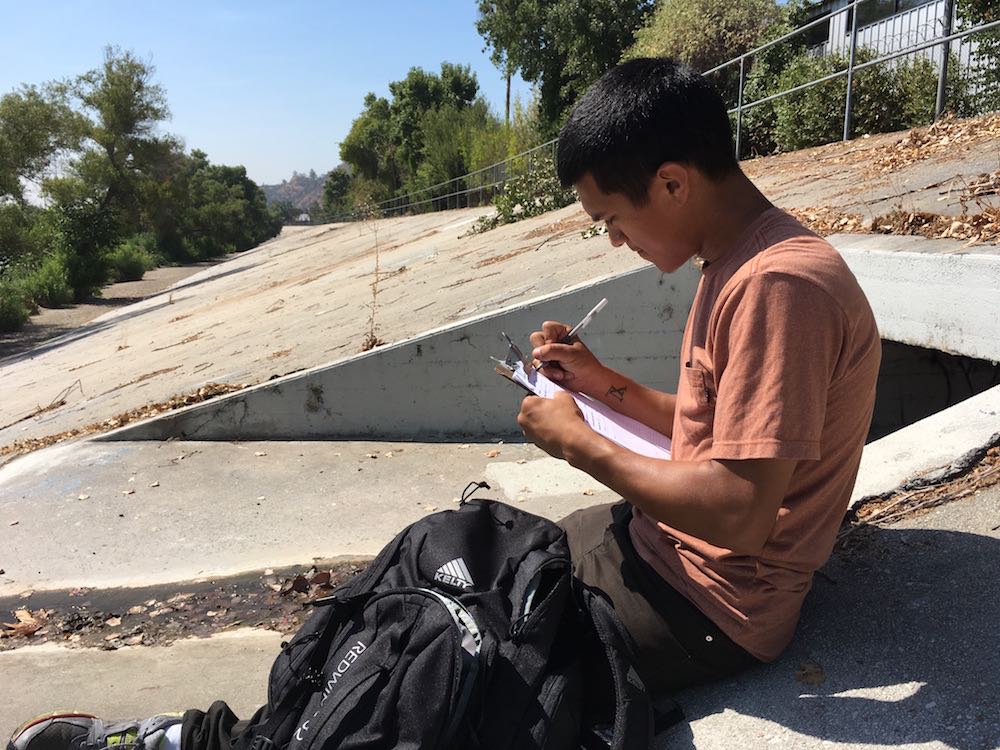
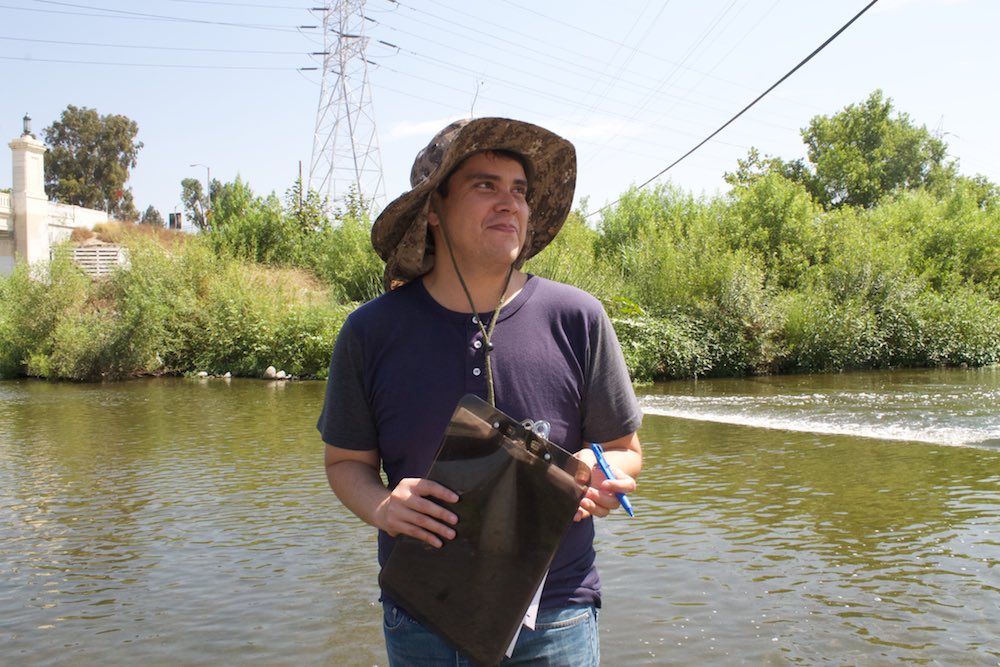

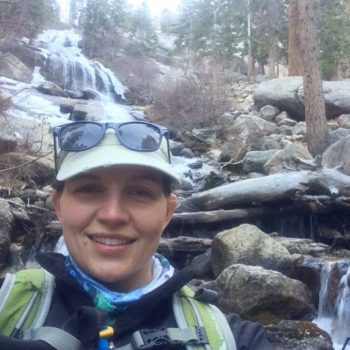
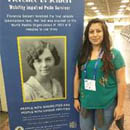
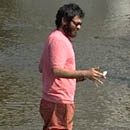


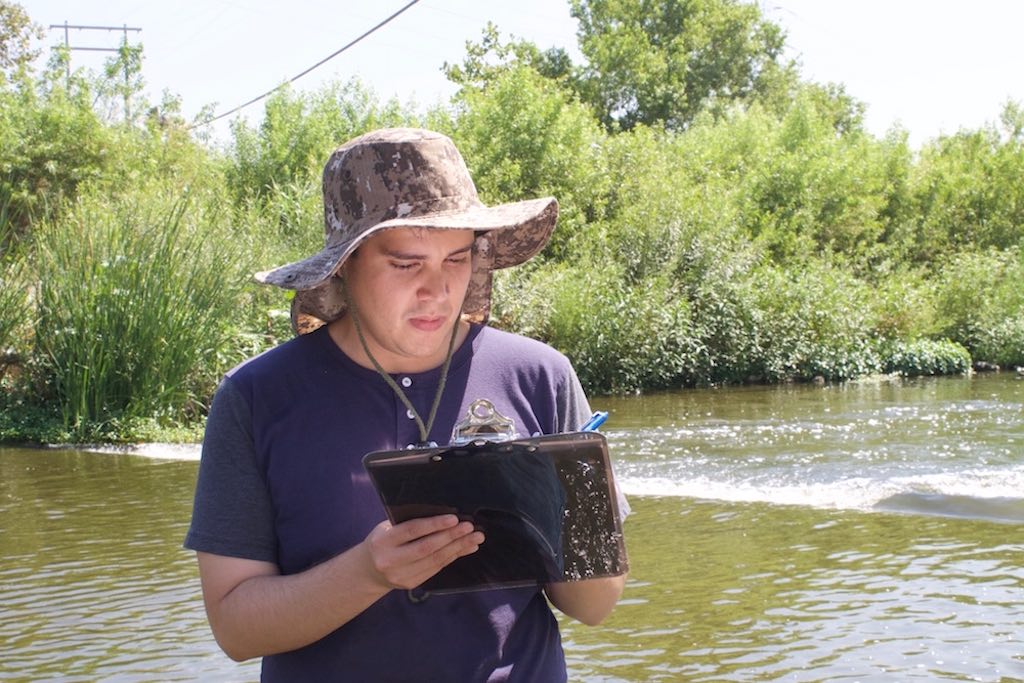 Photo of Nelson in the L.A. River. (Summer 2017)
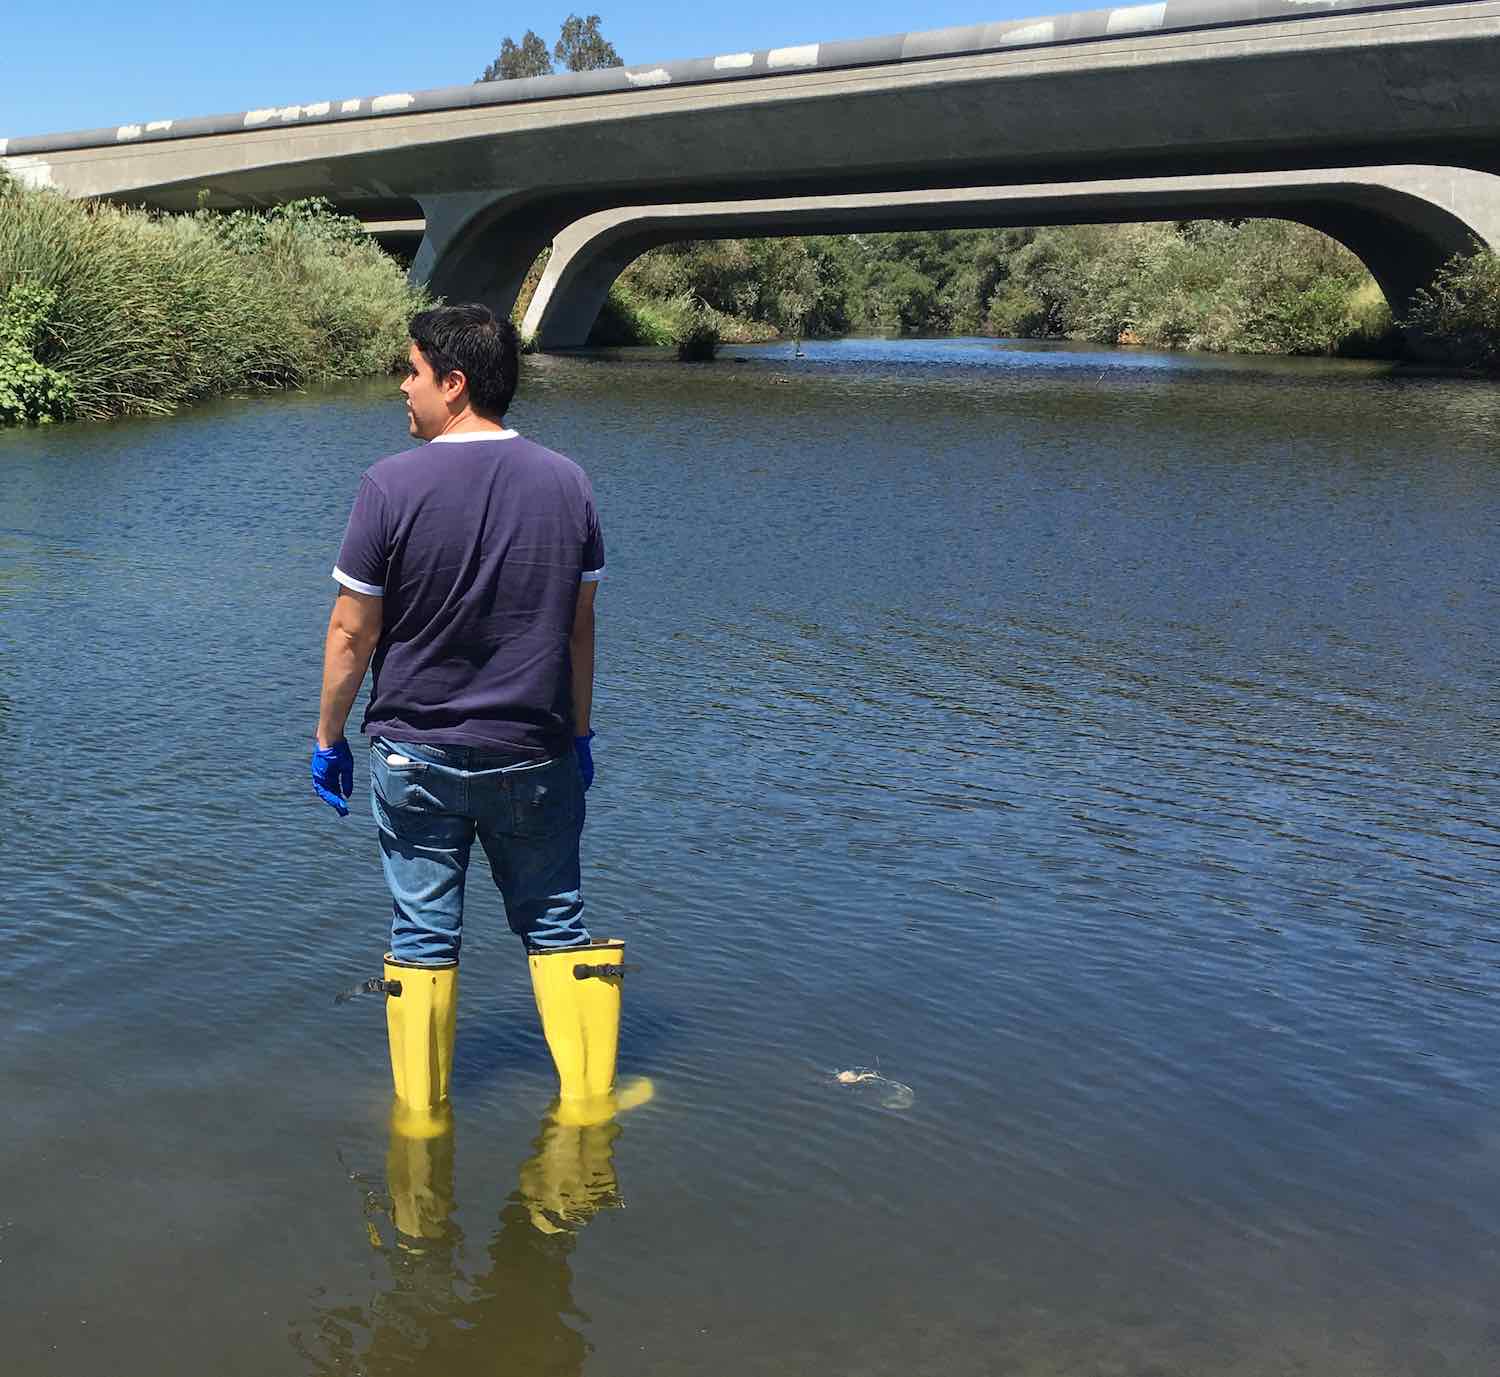 Photo of Nelson in the L.A. River collecting samples and observing conditions, by LA Times. (Summer 2017)
 Photo of Heal the Bay’s L.A. River water quality monitoring team in the LATTC lab discussing water test results. (Summer 2017)