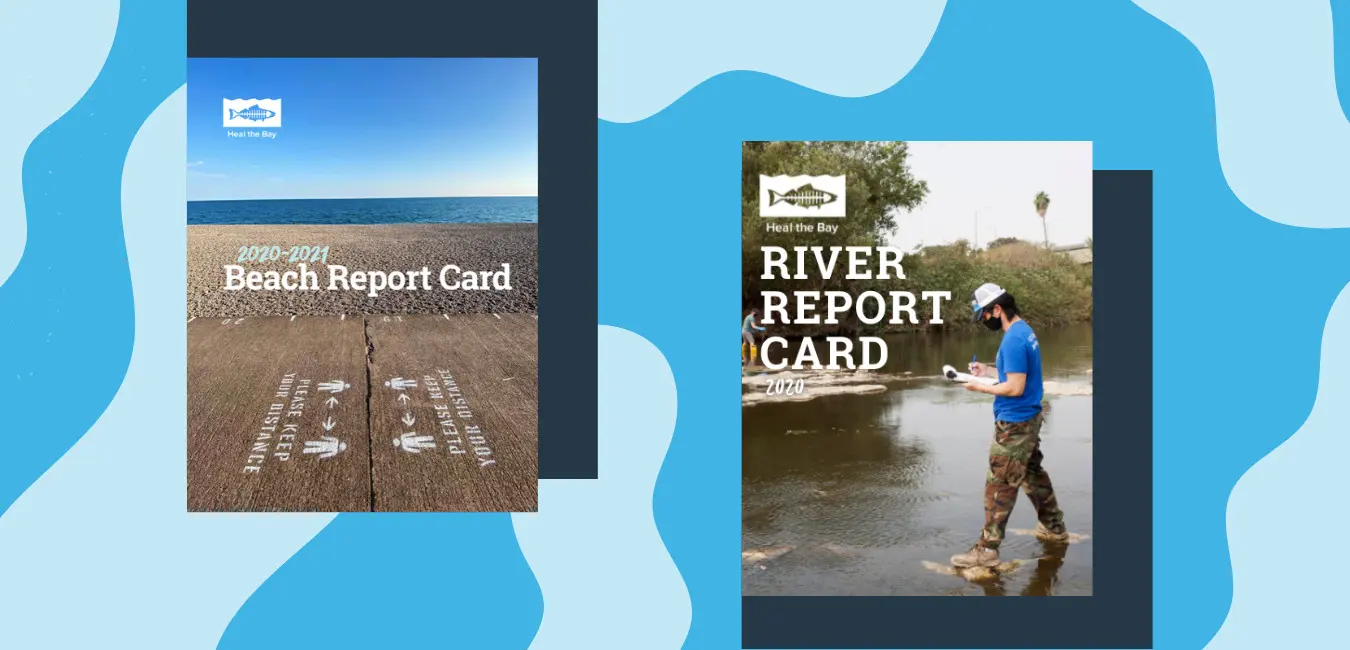
Heal the Bay’s Beach and River Report Cards have you covered for selecting the perfect swimming spot this summer 2022.
THE WARM SUMMER WEATHER in our region is inspiring many Angelenos to cool off at local beaches and swimming holes. Heal the Bay is here with the latest water quality grades AND a list of best and worst places to go in Los Angeles for swimming to keep you safe from harmful bacterial-pollution that can be lurking beneath the surface.
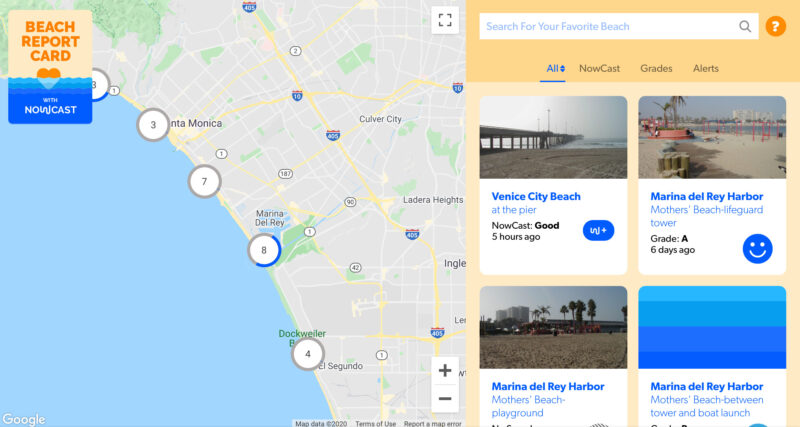
Review Heal the Bay’s easy-to-read maps of the latest water quality grades in Los Angeles and know where it is safe to swim (new grades are issued every Friday).
Summer is officially here – the peak season for swimming outdoors. Heal the Bay releases its annual scientific reports on bacterial-pollution rankings for hundreds of beaches in California and dozens of freshwater recreation areas in Los Angeles County.
SUMMARY
California beaches had excellent water quality in summer 2021, according to the thirty-second annual Beach Report Card that environmental nonprofit Heal the Bay released today. Heal the Bay assigned “A-to-F” letter grades for 500 California beaches in the 2021-2022 report, based on levels of fecal-indicator bacterial pollution in the ocean measured by County health agencies. In addition, the group ranked water quality at 35 freshwater recreation areas in Los Angeles County for summer 2021 and shared findings from the third annual River Report Card.
BEACH REPORT CARD HIGHLIGHTS
The good news is 94% of the California beaches assessed by Heal the Bay received an A or B grade during summer 2021, which is on par with the five-year average.
Even so, Heal the Bay scientists remain deeply concerned about ocean water quality. Polluted waters pose a significant health risk to millions of people in California. People who come in contact with water with a C grade or lower are at a greater risk of contracting illnesses such as stomach flu, ear infections, upper respiratory infections, and rashes. Beaches and rivers usually have high-risk water quality following a rain event. Less rain typically means that reduced amounts of pollutants, including bacteria, are flushed through storm drains and rivers into the ocean. Last year, rainfall across coastal counties in California was 24 percent lower than the historical average. Only 66% of California beaches had good or excellent grades during wet weather, which was a little above average, but still very concerning.
“A day at the beach and the river shouldn’t make anyone sick,” said Tracy Quinn, President and CEO of Heal the Bay. “It is wonderful news that most beaches in California have good water quality for swimming. But there are areas with poor water quality that need improvement and infrastructure upgrades. We can’t forget that our marine ecosystems are still threatened by the climate crisis and other pollution sources, and we need solutions to address these pressing issues as well. We expect people to increasingly seek out ocean shorelines and freshwater swimming holes to cool off as temperatures rise, so safe, clean, and healthy water is needed now more than ever.”
Heal the Bay’s Beach Report Card and River Report Card provide access to the latest water quality information and are a critical part of our science-based advocacy work in support of strong environmental policies that protect public health.
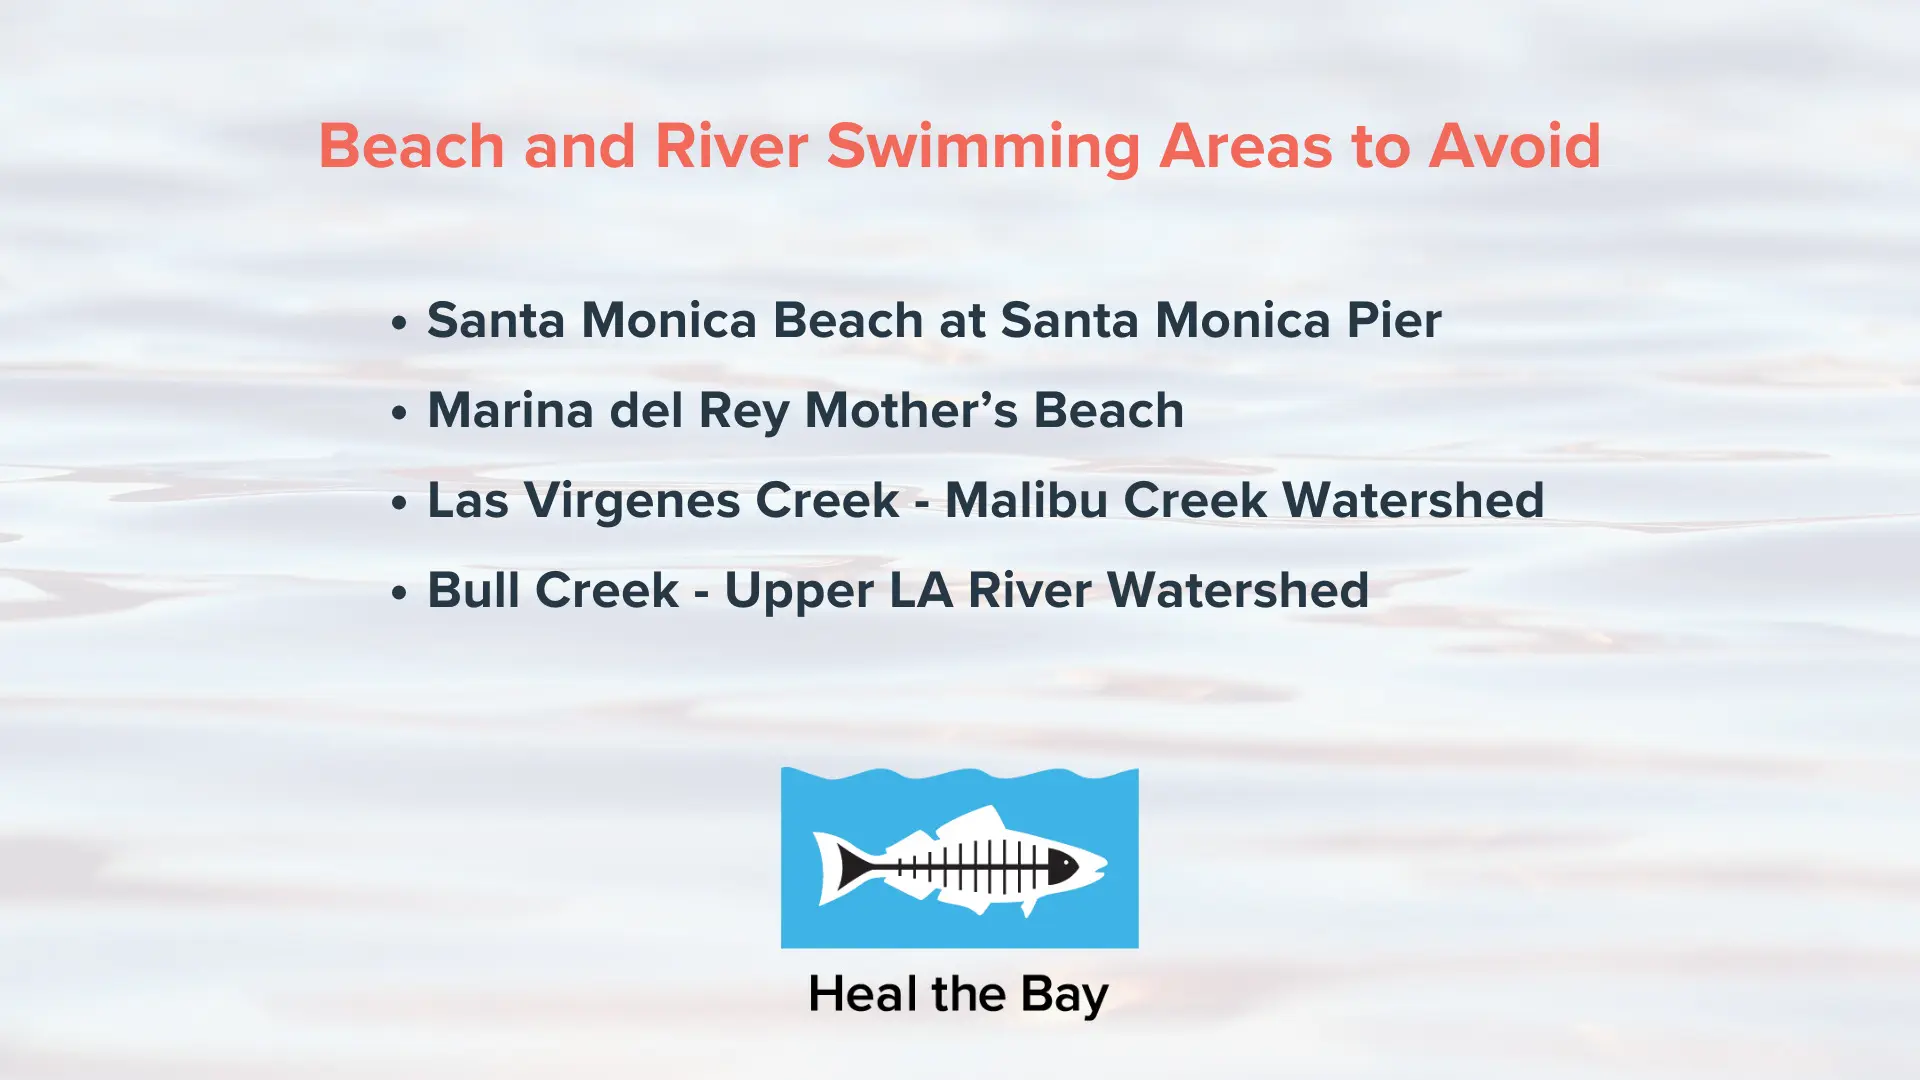
Heal the Bay’s Beach Bummer List ranks the most polluted beaches in California based on levels of harmful bacteria in the ocean. The 2021-2022 Beach Bummer List includes beaches in San Diego, San Mateo, Los Angeles, and Humboldt Counties, and for the first-time ever a beach in Baja California, Mexico makes the list (this beach is monitored by San Diego County).*
Playa Blanca (Baja California, Mexico)
Erckenbrack Park (San Mateo County)
Marlin Park (San Mateo County)
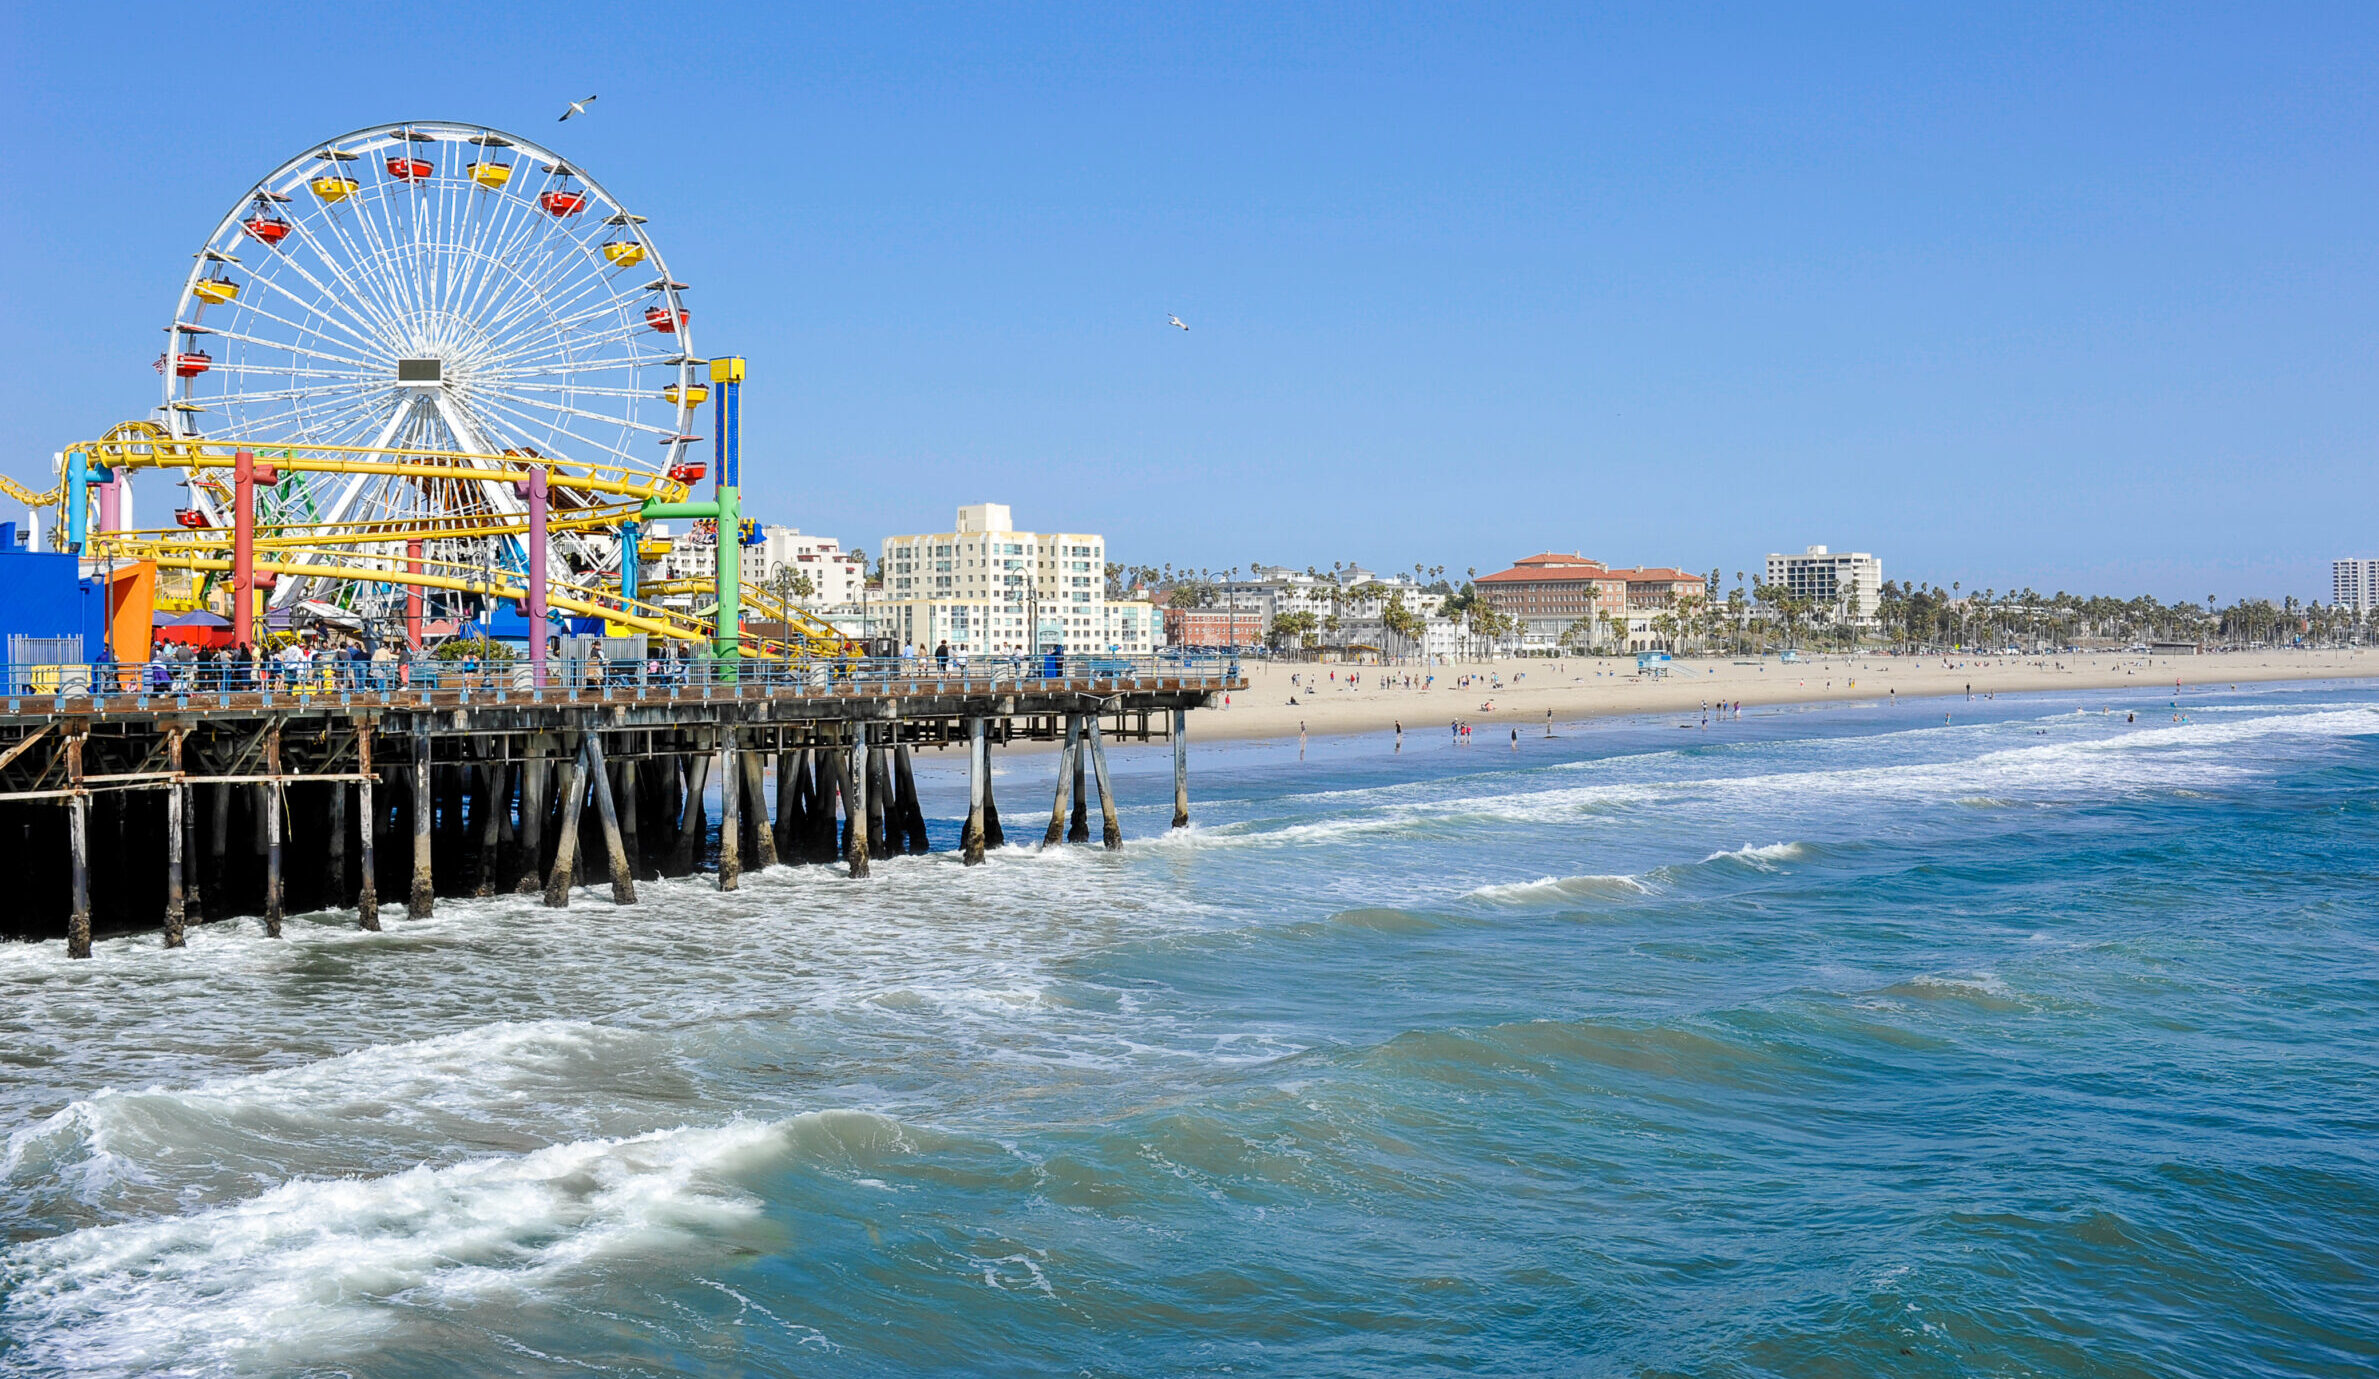
Santa Monica Pier (Los Angeles County)
Marina del Rey Mother’s Beach, at lifeguard tower (Los Angeles County)
Moonstone County Park (Humboldt County)
Newport Bay, Vaughn’s Launch (Orange County)
Lakeshore Park (San Mateo County)
Marina del Rey Mother’s Beach, between lifeguard tower and boat dock (Los Angeles County)
Tijuana Slough, North of Tijuana River Mouth (San Diego County)
BEACH HONOR ROLL LIST
Heal the Bay’s Honor Roll List includes 51 California beaches that scored perfect water quality grades year-round (compared to 35 beaches in the prior year). Most beaches on the Honor Roll are in Southern California because many counties in Central California and Northern California do not sample frequently enough during the winter months. Orange County had the most beaches on the Honor Roll. Los Angeles, San Luis Obispo, San Diego, and Santa Barbara Counties also had beaches with perfect water quality grades. San Francisco, Ventura, and Alameda Counties had no beaches on the Honor Roll.
Venice City Beach, at Brooks Ave. drain (Los Angeles County)
Rancho Palos Verdes, Long Point (Los Angeles County)
Royal Palms State Beach (Los Angeles County)
Palos Verdes Estates, at Malaga Cove trail outlet (Los Angeles County)
Las Tunas County Beach, at Pena Creek (Los Angeles County)
Nicholas Beach, at San Nicholas Canyon Creek (Los Angeles County)
Dana Point Harbor Youth Dock (Orange County)
Dana Point Harbor Guest Dock (Orange County)
Poche Beach (Orange County)
Doheny Beach (Orange County)
Doheny State Beach, end of the park (Orange County)
Doheny State Beach, at last campground (Orange County)
Corona Del Mar (Orange County)
Crystal Cove (Orange County)
Marine Science Institute Beach (Orange County)
Dana Point, Capistrano County Beach (Orange County)
Doheny State Beach, Pedestrian Bridge (Orange County)
Dana Strands Beach (Orange County)
Huntington City Beach, at 17th Street (Orange County)
Bolsa Chica Reserve, at Flood Gates (Orange County)
Surfside Beach, at Sea Way (Orange County)
San Clemente, at Avenida Calafia (Orange County)
Salt Creek Beach (Orange County)
Laguna Lido (Orange County)
Treasure Island Beach (Orange County)
Del Mar, at 15th Street (San Diego County)
Carlsbad, at Tamarack Ave. (San Diego County)
Carlsbad, at Poinsettia Lane (San Diego County)
Carlsbad, at Encina Creek (San Diego County)
Carlsbad, at Palomar Airport Rd. (San Diego County)
Carlsbad, at Cerezo Drive (San Diego County)
Oceanside, at Forster Street (San Diego County)
Oceanside, Harbor Beach at Harbor Drive (San Diego County)
Point Loma, Lighthouse (San Diego County)
Point Loma, Point Loma Treatment Plant (San Diego County)
Sunset Cliffs, at Ladera Street (San Diego County)
Mission Beach, Belmont Park (San Diego County)
La Jolla Shores Beach, 1000 ft south of Scripps Pier (San Diego County)
La Jolla Shores Beach, 250 feet south of Scripps Pier (San Diego County)
La Jolla Shores Beach, 500 feet north of Scripps Pier (San Diego County)
Guadalupe Dunes (Santa Barbara County)
East Beach, at Sycamore Creek (Santa Barbara County)
El Capitan State Beach (Santa Barbara County)
Sands, at Coal Oil Point (Santa Barbara County)
Cayucos State Beach, downcoast of the pier (San Luis Obispo County)
Pismo Beach, at Ocean View (San Luis Obispo County)
Pismo Beach, at Wadsworth Street (San Luis Obispo County)
San Simeon State Beach, at Pico Ave. (San Luis Obispo County)
Morro Strand State Beach, at Beachcomber Drive (San Luis Obispo County)
Pismo State Beach, 571 yards south of Pier Ave. (San Luis Obispo County)
Pismo State Beach, 330 yards north of Pier Ave. (San Luis Obispo County)
“The World Surf League is incredibly proud to partner with Heal the Bay to upgrade the Beach Report Card for all ocean lovers to be informed about water quality prior to heading to their favorite beach. Through the partnership we are investing in improvements to the user experience of the Beach Report Card website and app, and we will be activating local surfers to protect the health of 150 million beachgoers in California,” said Emily Hofer, Chief People Officer and Executive Director WSL PURE at World Surf League (WSL).
RIVER REPORT CARD HIGHLIGHTS
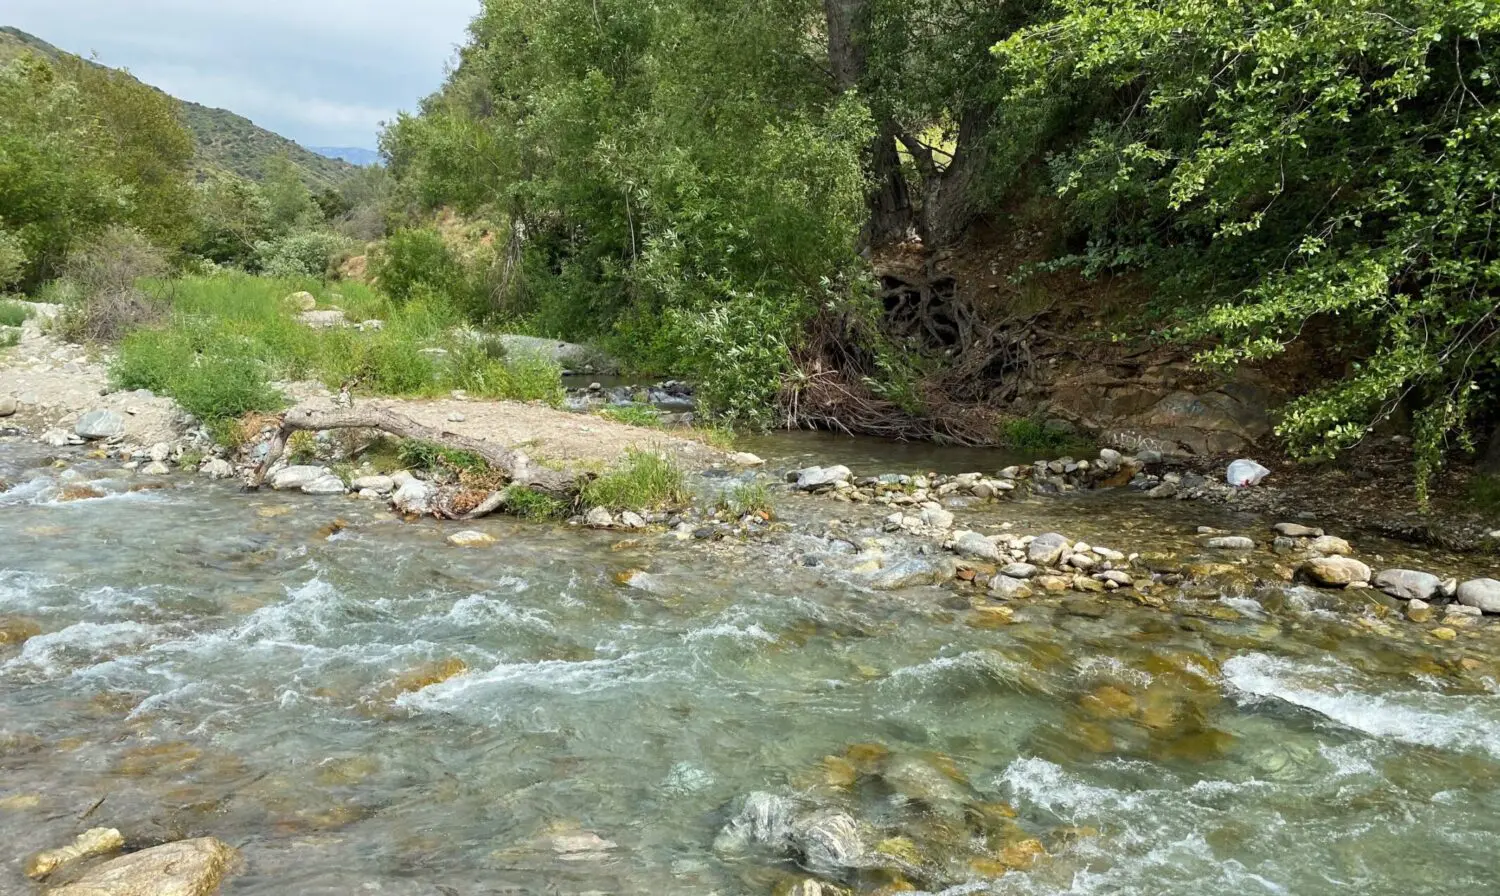
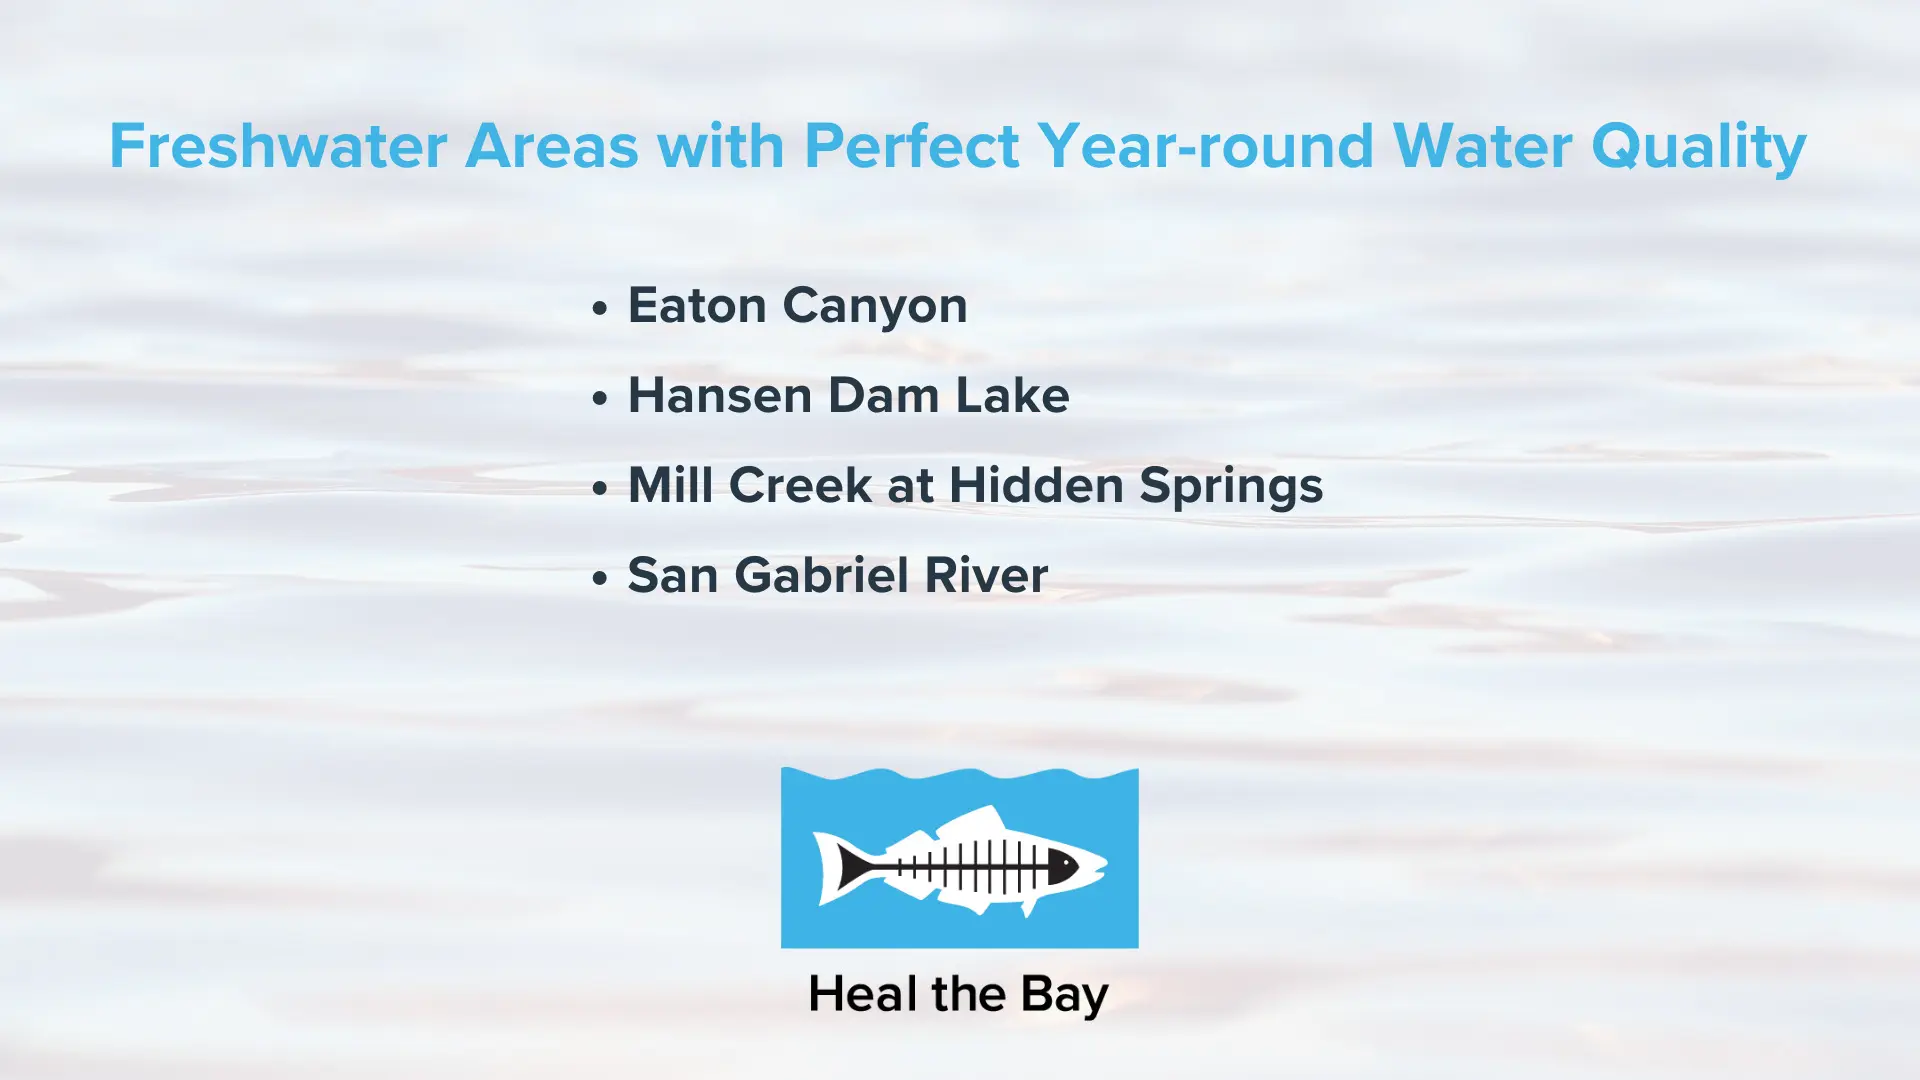
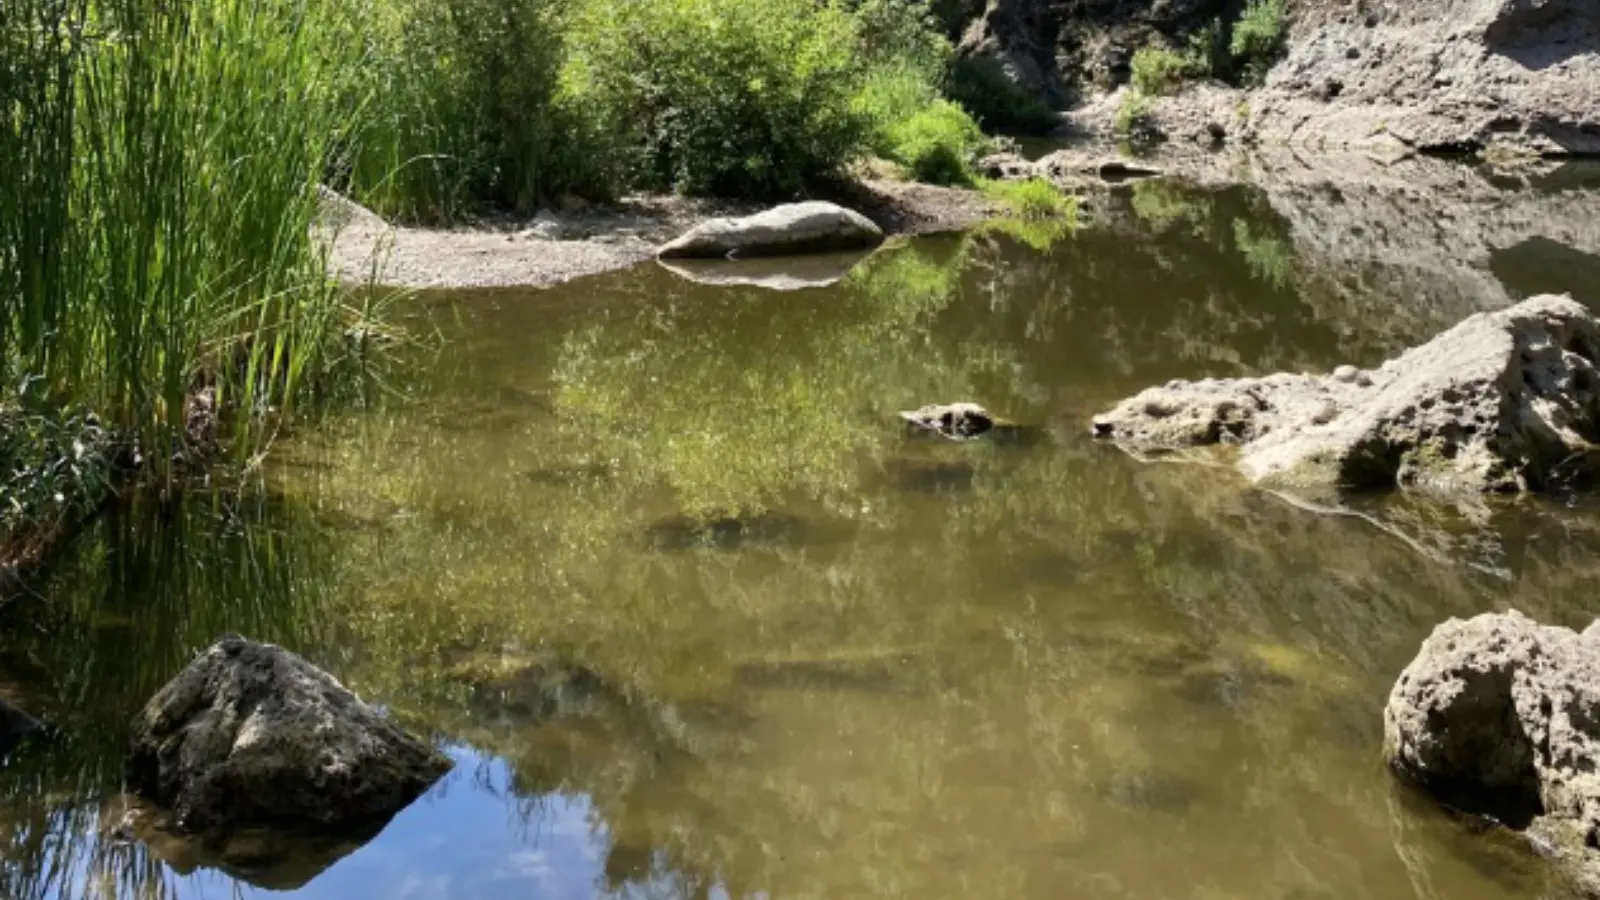
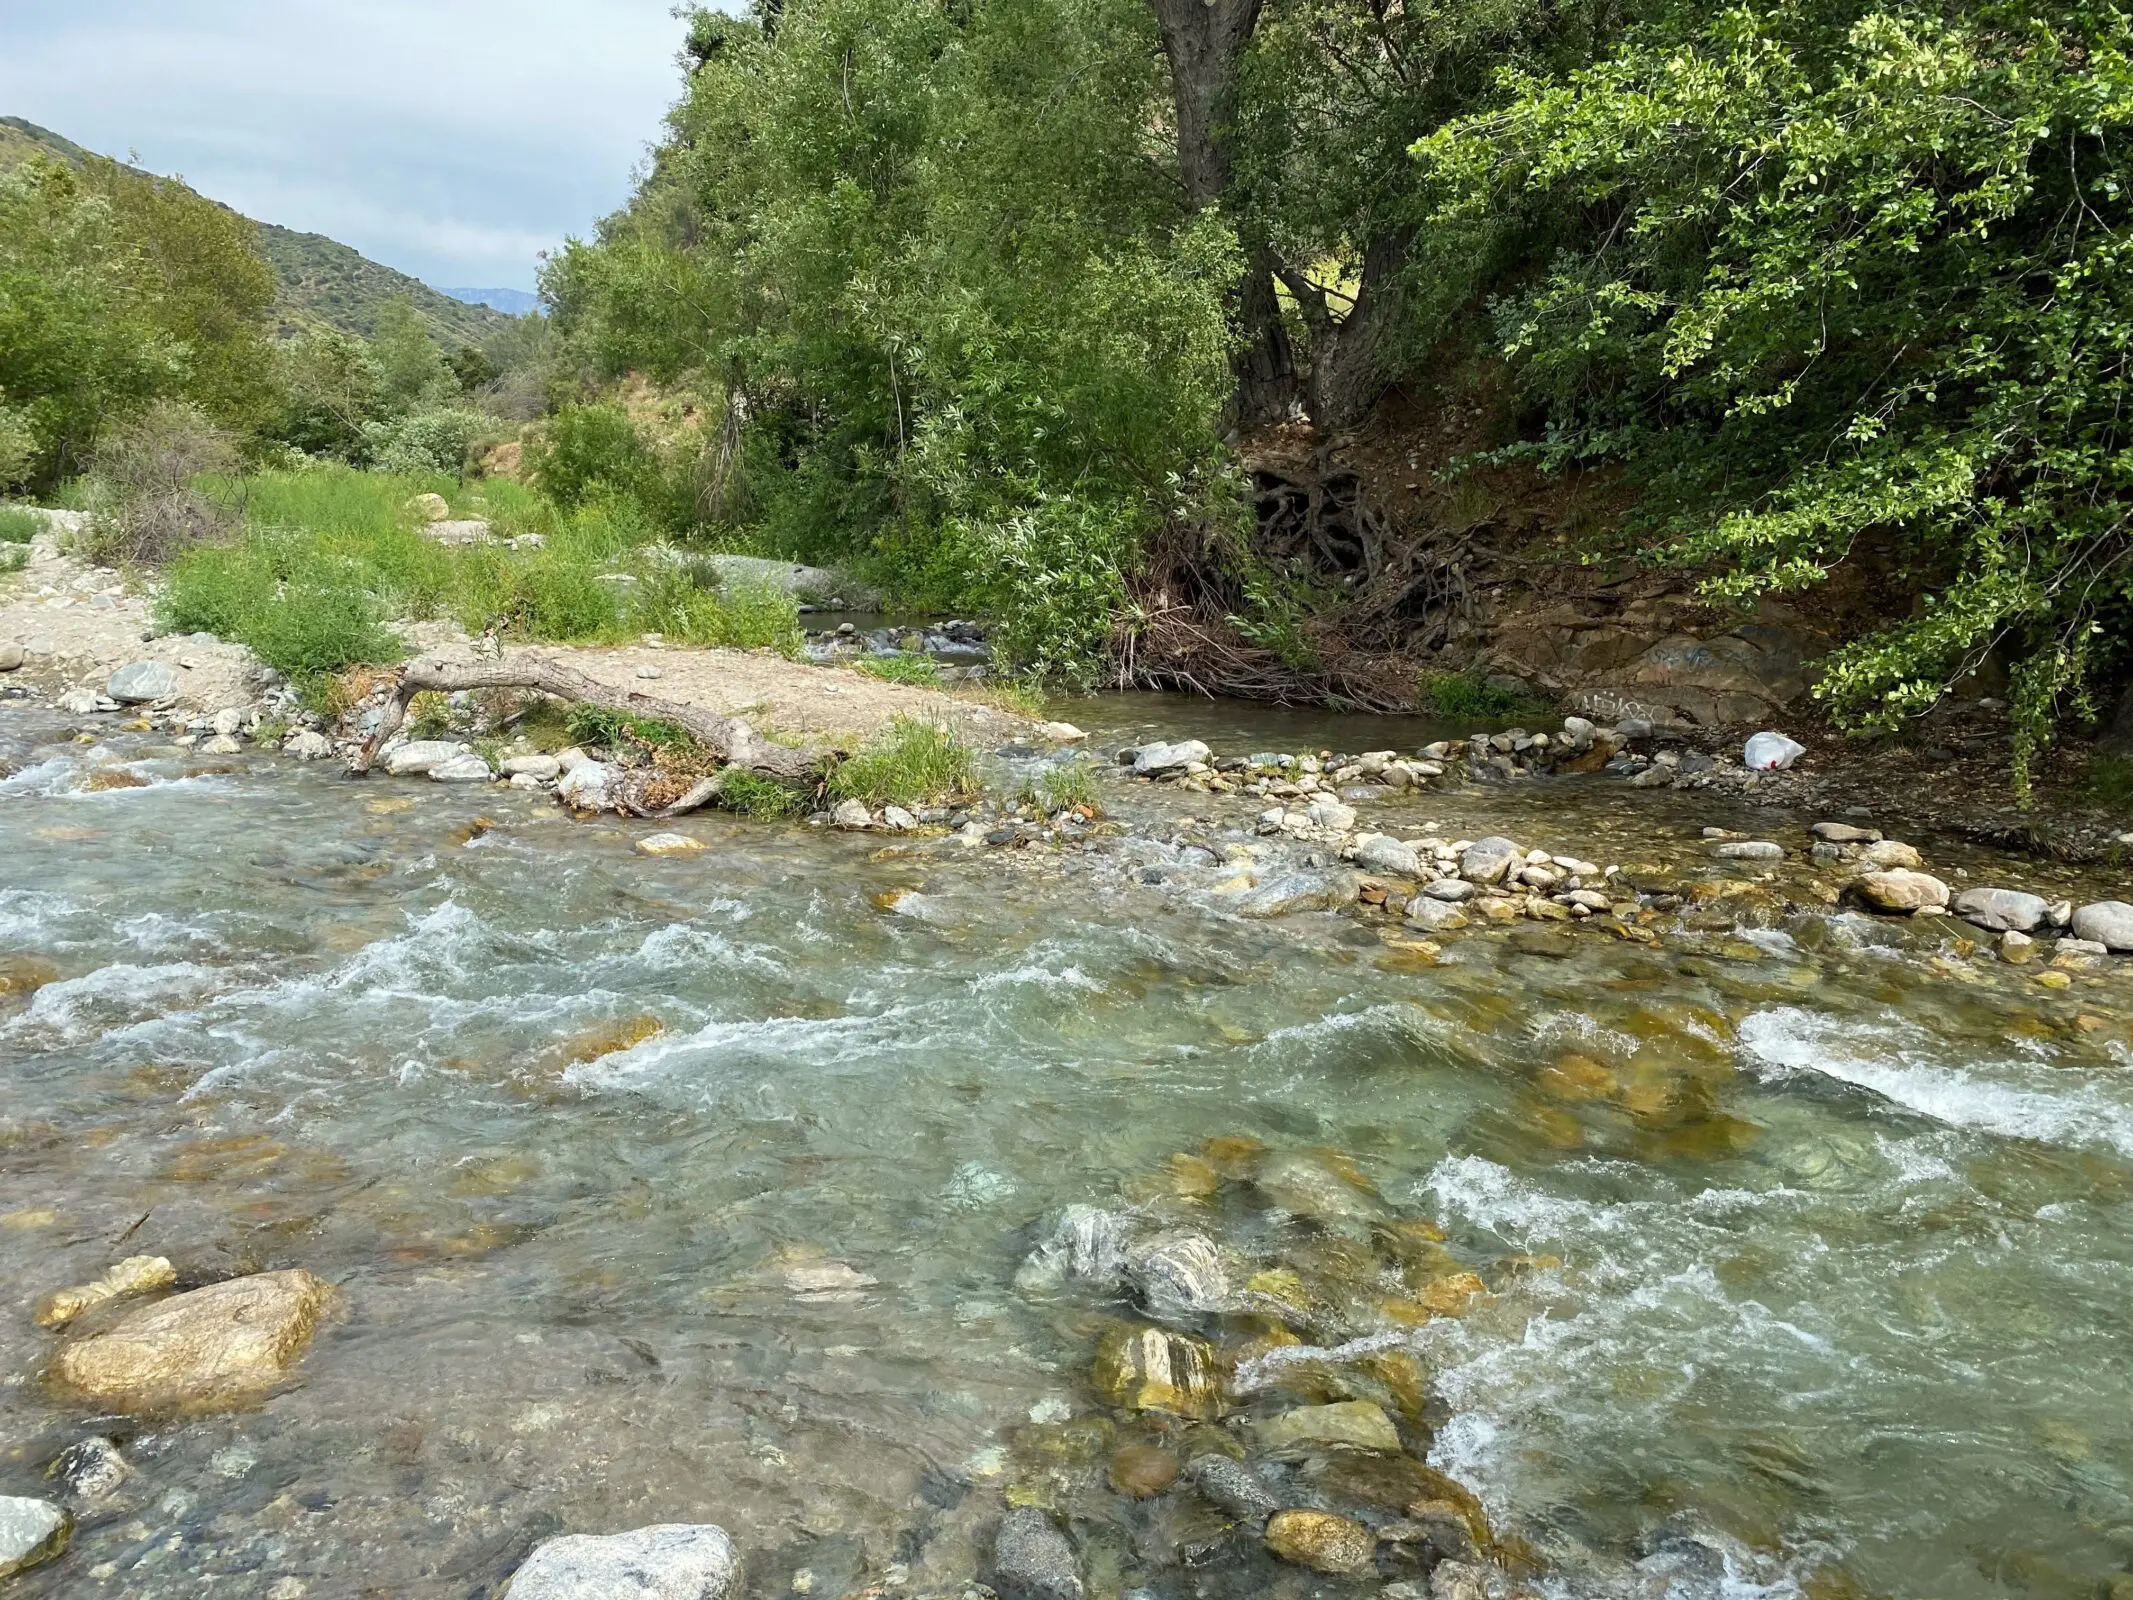
Heal the Bay graded 35 freshwater recreation areas in Los Angeles County within the L.A. River, San Gabriel River, and Malibu Creek Watersheds during summer 2021. 59% of the grades across all LA freshwater sites and all dates indicated a low risk of illness, 17% indicated a moderate risk of illness, and 24% indicated a high risk of illness.
“Our River Report Card identifies a disturbing trend between development and water quality. The natural areas in our watersheds, rivers and streams with muddy bottoms and ample flora, have the best water quality and are the safest for the public. While heavily developed areas, waterways encased with concrete (including within the L.A. River channel), tend to have lower water quality. We recommend checking out the River Report Card before heading out to the L.A. River because bacteria levels are often at unsafe levels and you can find a safer spot for cooling off,” said Luke Ginger, Water Quality Scientist and author of the River Report Card and Beach Report Card.
Avoid shallow, enclosed beaches with poor water circulation.
Swim at least 100 yards away from flowing storm drains, creeks, and piers.
Stay out of the water for at least 72-hours after a rain event.
Follow all local health and safety regulations, including all local pandemic-related regulations.
Check in with the lifeguard or ranger on duty for more information about the best places to swim.
ACCESS TO WATER RECREATION
The COVID-19 pandemic, record-setting wildfire seasons, and extreme heat have compounded the already dire need for equity in our recreational waters, and exposed major systemic failures; open spaces, including beaches and rivers, are not equally accessible to all people. Low-income communities of color tend to be the most burdened communities, bearing the brunt of environmental pollution, socioeconomic disparities, and limited access to safe, healthy, and clean water recreation. Heal the Bay is committed to expanding the user base of our Beach Report Card and River Report Card. We have started by working with local community-based organizations that are taking down barriers to water recreation for communities of color. Through this work, we will amplify what “safe, healthy, and clean access to water recreation” means in the communities where it is needed the most.
About Heal the Bay: Heal the Bay is a 501(c)3 nonprofit organization founded in 1985. They use science, education, community action, and advocacy to fulfill their mission to protect coastal waters and watersheds in Southern California. Heal the Bay Aquarium, located at the Santa Monica Pier, welcomes 100,000 guests annually and hosts a variety of public programs and events that highlight local environmental issues and solutions. Learn more at healthebay.org and follow @healthebay on social media.
About Beach Report Card: Beach Report Card with NowCast, in partnership with World Surf League, is Heal the Bay’s flagship scientific water quality monitoring program that started in the 1990s. For thirty years, the Beach Report Card has influenced the improvement of water quality by increasing monitoring efforts and helping to enact strong environmental and public health policies. Learn more at beachreportcard.org and download the free app on Apple and Android devices. The Beach Report Card is made possible through generous support from SIMA Environmental Fund, SONY Pictures Entertainment, and World Surf League.
About River Report Card: Currently, there is no statewide water quality monitoring mandate for rivers and streams in California, like we have for the ocean as a result of the Beach Report Card. Heal the Bay started the River Report Card in 2017 to push for new public health protections for freshwater areas in addition to serving the immediate need for increased public awareness about the risks at popular freshwater recreation areas in Los Angeles County. Learn more at healthebay.org/riverreportcard. The River Report Card is brought to you by Garfield Foundation, Watershed Conservation Authority, Environment Now, and Rivers and Mountains Conservancy.
View the Beach Report Card and River Report Card from last year.
*EDITOR NOTE: An earlier version of this blog post included Santa Cruz and Santa Barbara Counties within this paragraph description of the Beach Bummers, which was in error. Neither of these Counties have beaches on Heal the Bay’s Beach Bummers list this year.
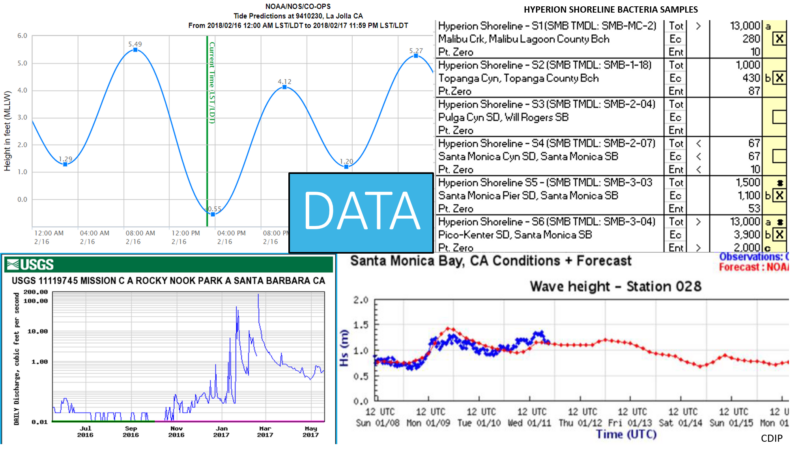
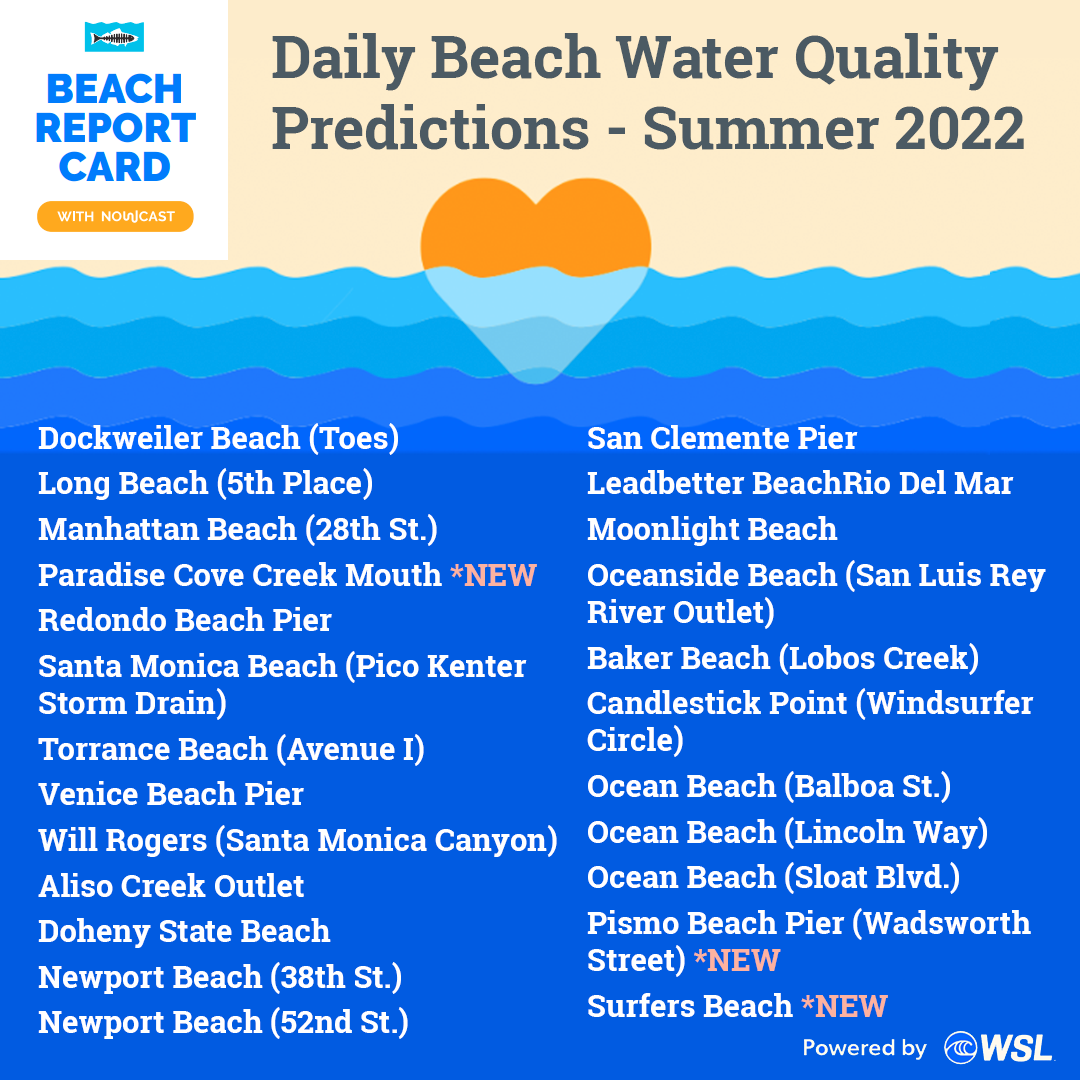
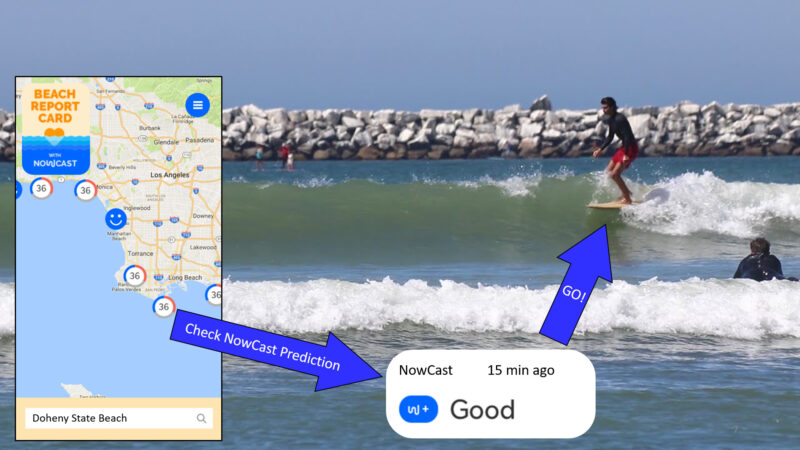
FOR THE EIGHTH STRAIGHT SUMMER, Heal the Bay is posting daily water quality predictions for California Beaches on our Beach Report Card with NowCast. To make daily predictions, we use computer models to examine correlations between historical bacteria concentrations and environmental conditions (such as temperature, rain and tide). Our NowCast models then predict with a high accuracy how much bacteria could be present in the water given the current local conditions at the beach.
A day at the beach should not make anyone sick. That is why health officials across the state monitor water quality at the beach every week during the summer. And when officials detect high levels of bacteria, they issue a public health advisory. By the time traditional water quality samples are processed, a minimum of 18-24 hours have passed and the information is already outdated – and with samples taken only every 7 days, a weekly water quality grade may not provide the most useful or updated information as water quality can fluctuate rapidly. Heal the Bay advocates for daily water quality information in order to better protect public health – our NowCast program provides exactly that, issuing daily water quality information for 25 beaches.
Good Water Quality
Poor Water Quality
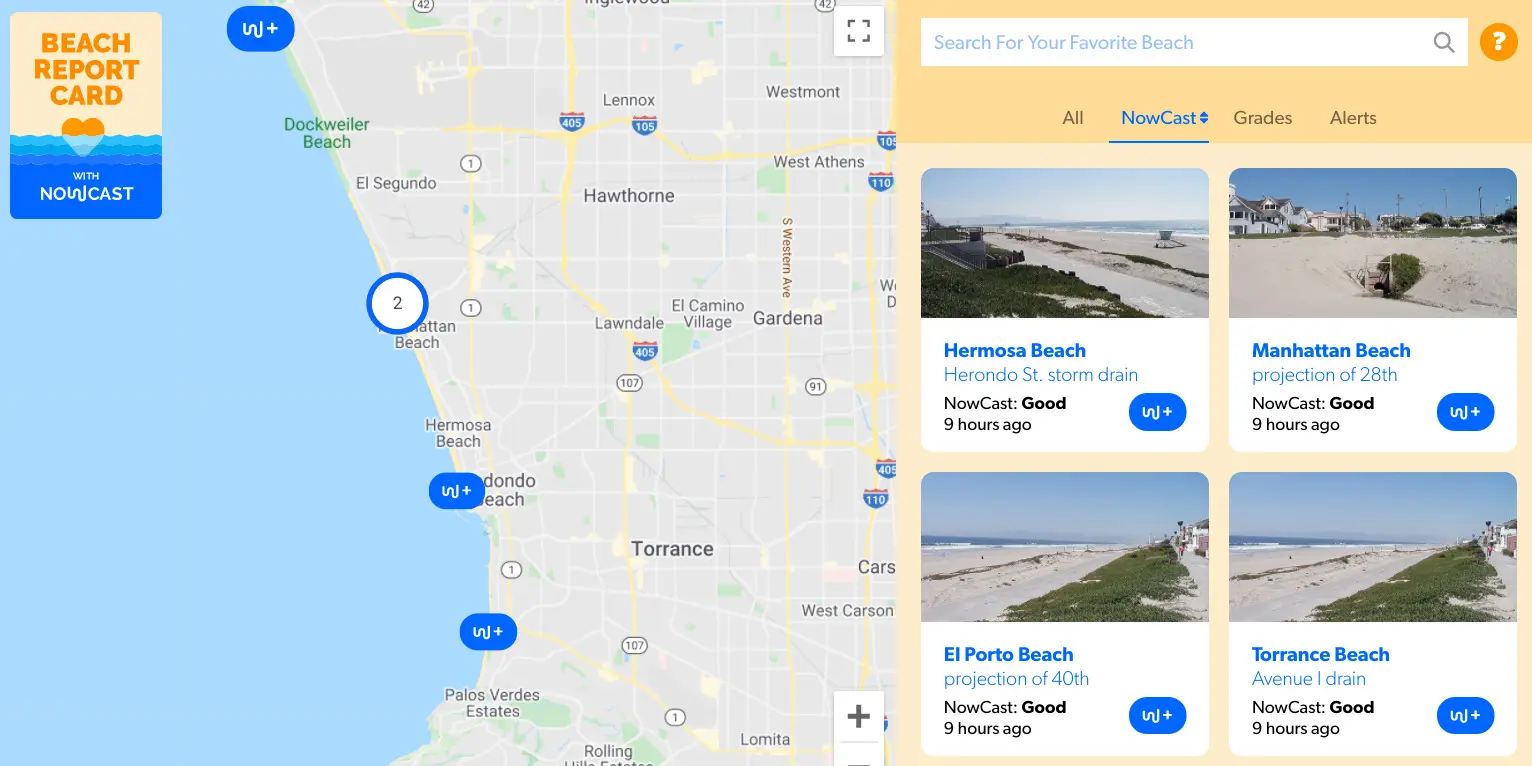
NowCast predictions appear on the Beach Report Card website and app with the symbols seen below. A Blue “W+” symbol indicates that there is a low risk of illness when coming in contact with the water, and a Red “W-” symbol indicates that there is a high risk of illness when coming in contact with the water.
Head to beachreportcard.org to find daily predictions for 25 beaches across California. Or download our free app on your iOS or Android device to get daily predictions on-the-go.
Just in time for Memorial Day weekend and the unofficial start of summer 2022, we are excited to announce the 25 beaches in our NowCast program, with three new beaches added to the program in 2022:
Dockweiler Beach (Toes), Los Angeles County
Long Beach (5th Place), Los Angeles County
Manhattan Beach (28th St.), Los Angeles County
Paradise Cove Creek Mouth, Los Angeles County *NEW
Redondo Beach Pier, Los Angeles County
Santa Monica Beach (Pico Kenter Storm Drain), Los Angeles County
Torrance Beach (Avenue I), Los Angeles County
Venice Beach Pier, Los Angeles County
Will Rogers (Santa Monica Canyon), Los Angeles County
Aliso Creek Outlet, Orange County
Doheny State Beach, Orange County
Newport Beach (38th St.), Orange County
Newport Beach (52nd St.), Orange County
San Clemente Pier (Lifeguard Tower), Orange County
Leadbetter Beach, Santa Barbara County
Rio Del Mar, Santa Cruz County
Moonlight Beach, San Diego County
Oceanside Beach (San Luis Rey River Outlet), San Diego County
Baker Beach (Lobos Creek), San Francisco County
Candlestick Point (Windsurfer Circle), San Francisco County
Ocean Beach (Balboa St.), San Francisco County
Ocean Beach (Lincoln Way), San Francisco County
Ocean Beach (Sloat Blvd.), San Francisco County
Pismo Beach Pier (Wadsworth Street), San Luis Obispo County *NEW
Surfers Beach, San Mateo County *NEW
Don’t see your beach on the map? Let us know if you have a beach we should consider for NowCast — we are continually refining and expanding this program and hope to cover more beaches in the future. Predicting water quality is complex and we want to make sure we get it right. This means we need access to a myriad of data sources in order to make accurate predictions, and when data are not readily available, we can’t make the prediction.
Communities looking to bring daily water quality predictions to their favorite beach spots can advocate for this cause in the following ways:
Advocate at town halls and city council meetings for increased funding toward ocean and environmental data observation, collection, standardization, and analysis programs.
Support Heal the Bay’s staff scientists efforts to expand monitoring programs and directly fund our work.
Stay informed about your local water quality and reach out to your representatives in California demanding improvements be made to protect public health and our natural environment.
If you can’t find NowCast predictions in your area, you can see the latest water quality grades issued to over 500 beaches on the Beach Report Card Website. In the meantime, we are working to improve and expand the NowCast system so check back frequently to see if your favorite beach has water quality predictions.
Written by Alison Xunyi Wu. Alison is passionate about using data and science to provide the public with the information they need to avoid environmental microbial pollutants. As Heal the Bay’s Associate Data Specialist, she is currently working on the NowCast models, Beach Report Card, and River Report Card programs by collecting and analyzing environmental bacterial datasets.
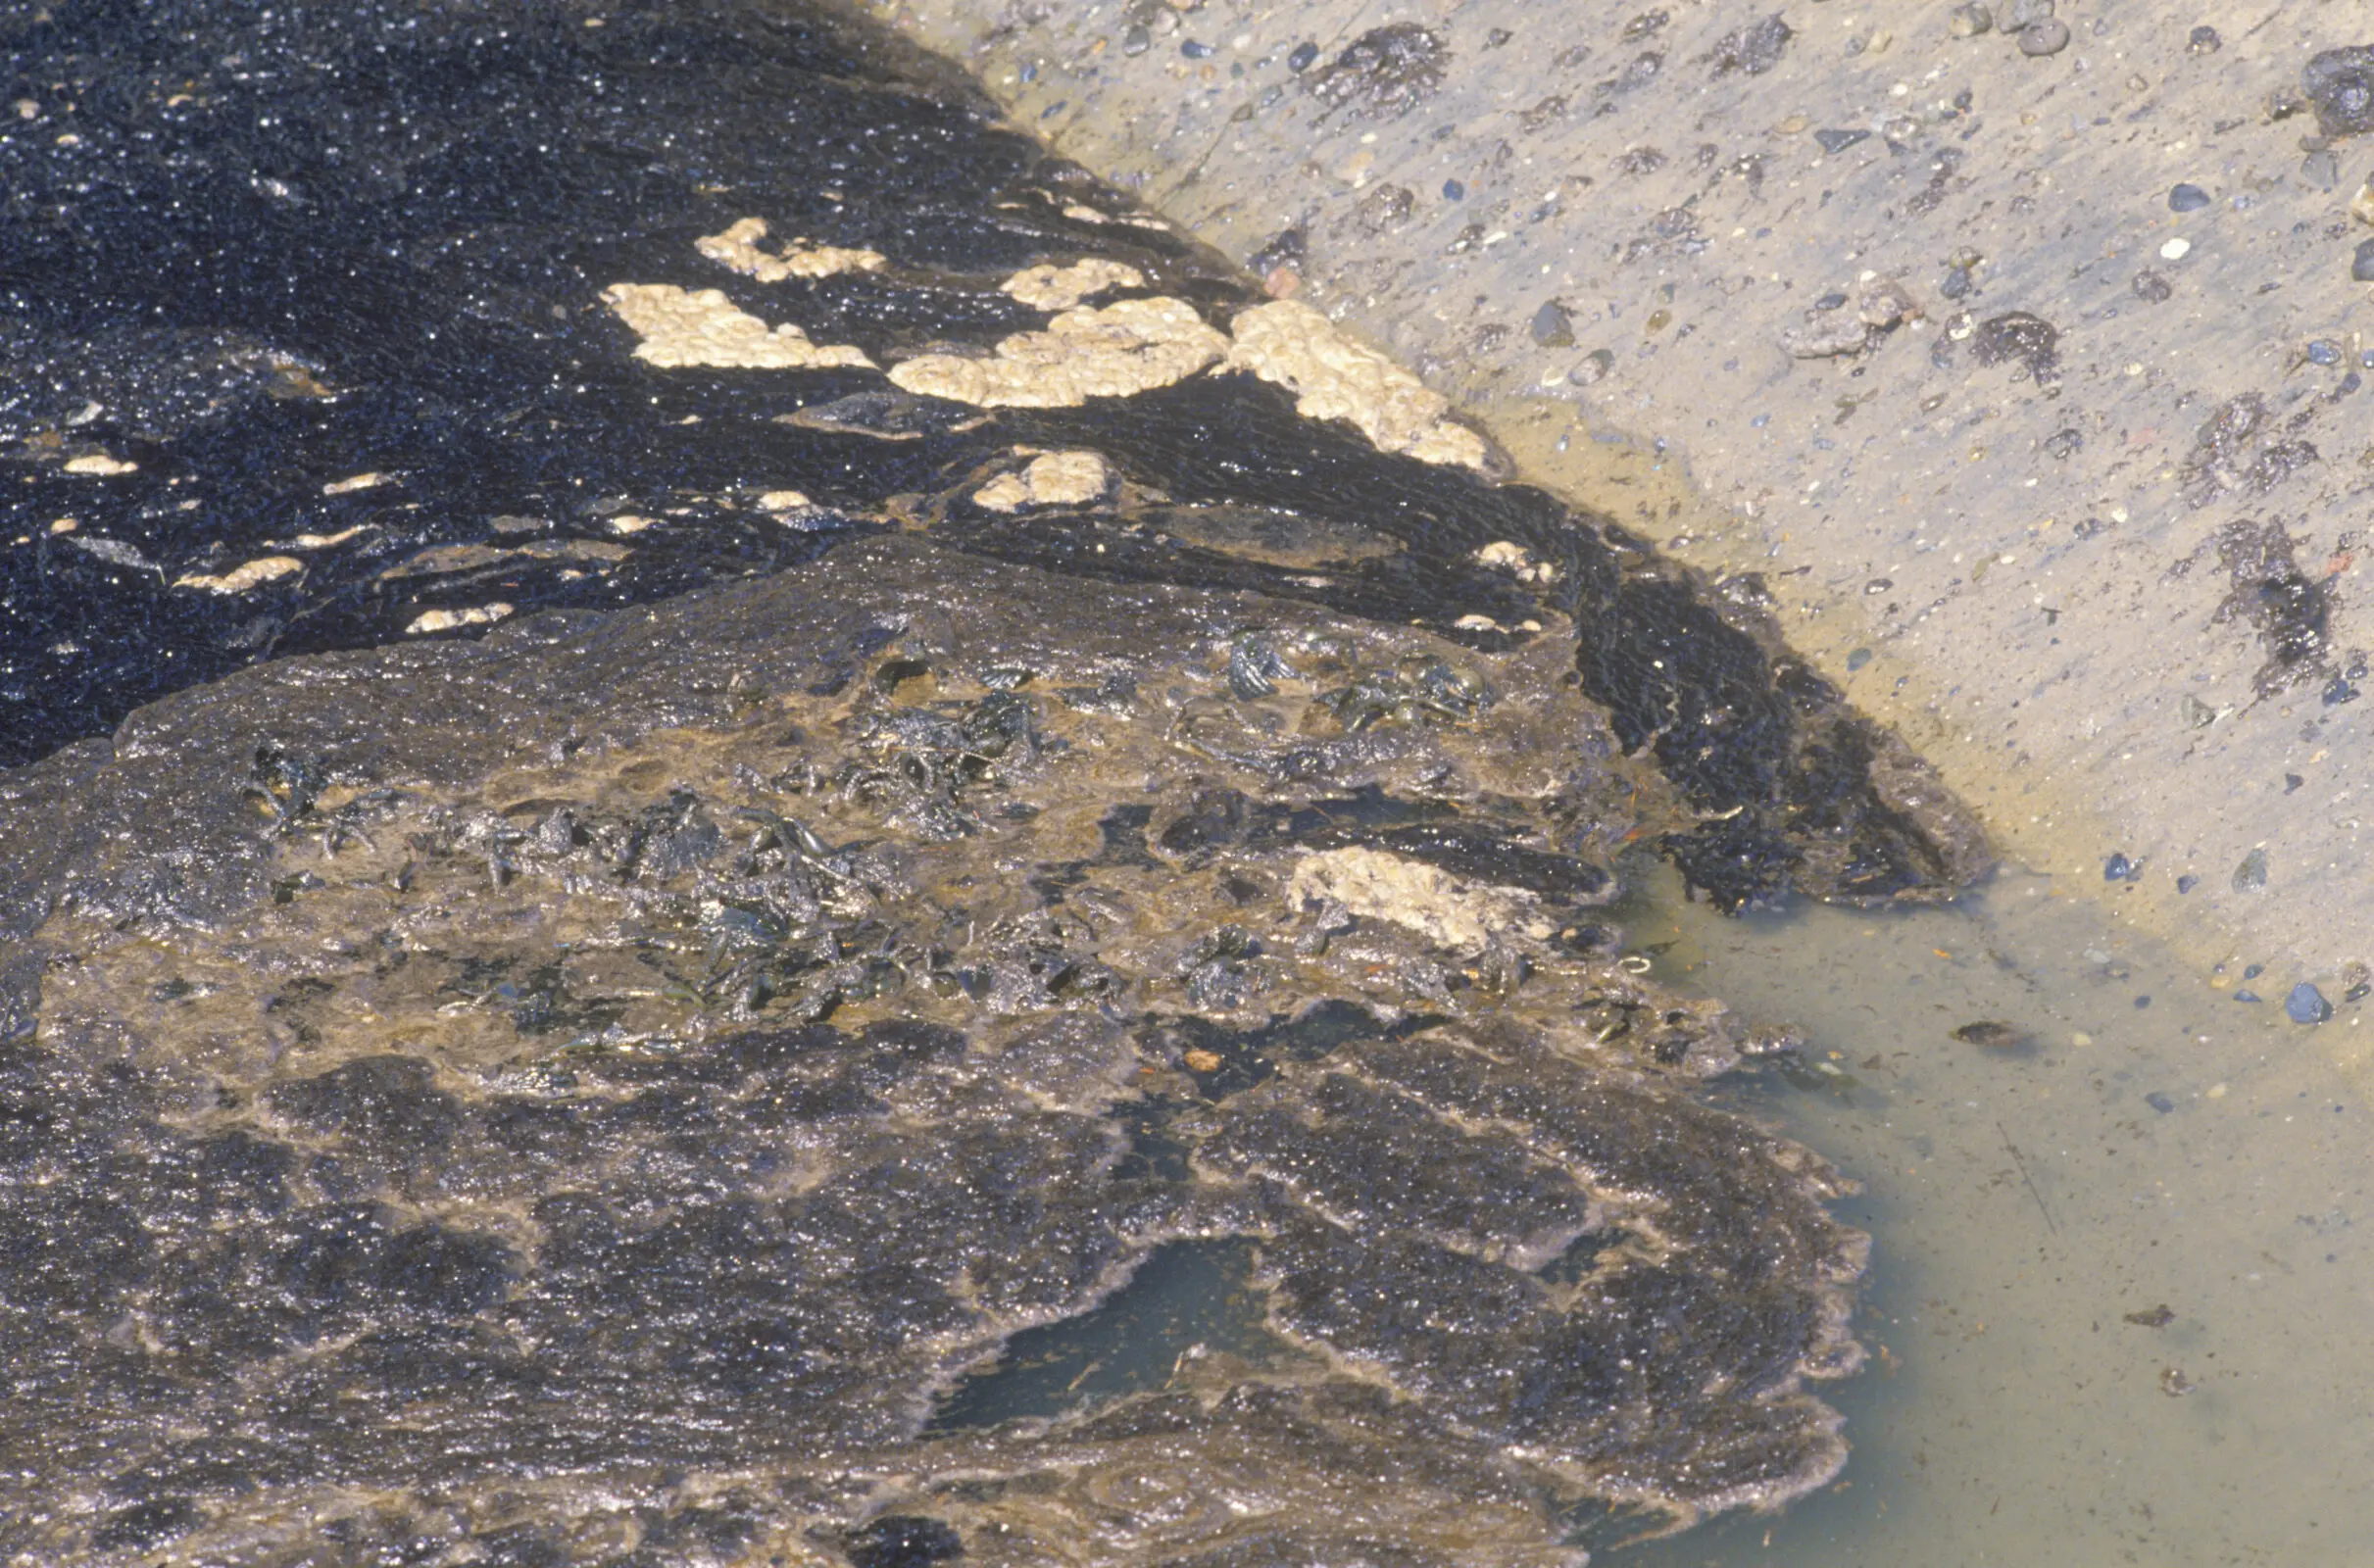
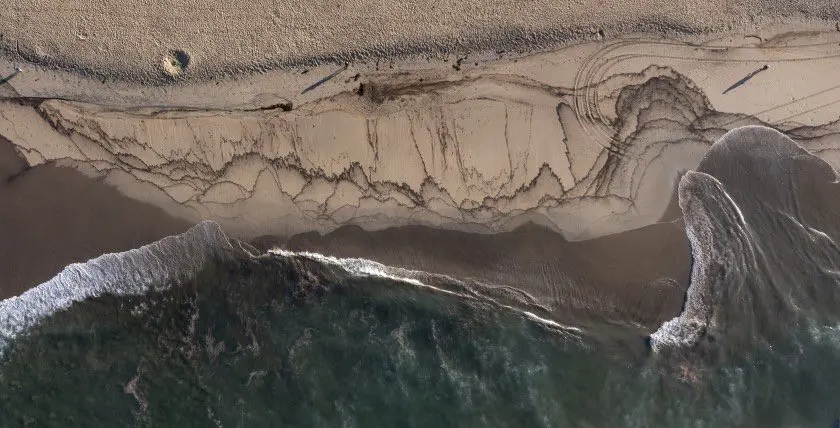
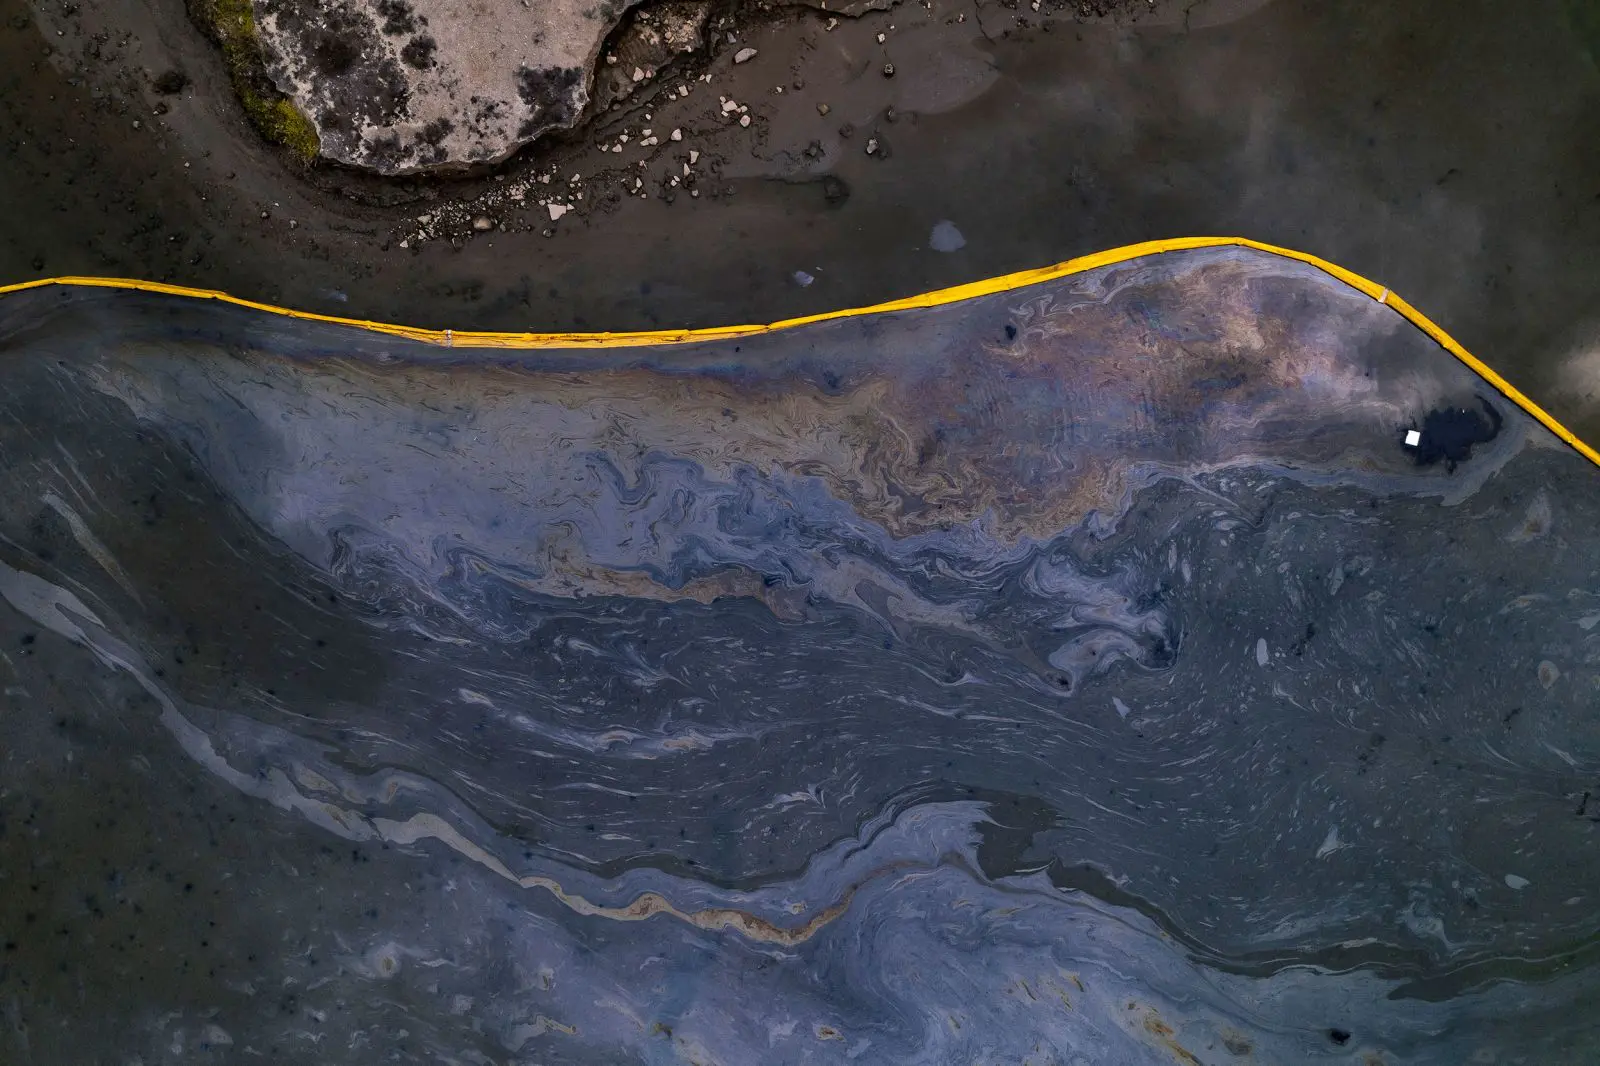
We are heartbroken and outraged. Crude oil spilled from a pipe into the ocean near Huntington Beach, Orange County in October 2021. Here’s how to take action. This oil spill has taken place in unceded Acjachemen and Tongva ancestral waters.
LATEST UPDATE as of 2/8/22
The government agencies responding to the oil spill announced last week that their cleanup operations have ended for the two ruptured pipelines off the coast of Huntington Beach. All coastal habitats are deemed to be clean of oil, and the phone number and email address for reporting tarballs have been disabled. The public has been advised to contact the National Response Center (1-800-424-8802) if more oil is observed on the beach or in the water.
While the cleanup has concluded, the response to the oil spill is far from over. The California Department of Fish and Wildlife (CDFW) will now complete a Natural Resource Damage Assessment (NRDA). The NRDA will financially quantify the damage done by the oil spill in terms of habitat and human usage. The assessment has required that Amplify Energy pay that amount in restitution. The CDFW will need to conduct multiple scientific studies to collect and analyze a large volume of environmental data, so expect the NRDA to take several years to finalize.
We will not know the full environmental impact of the oil spill until the NRDA concludes, but we do have some preliminary details. The first ruptured pipeline released 25,000 gallons of oil into the ocean, and cleanup crews managed to remove 9,076 gallons. That means over half the oil that was spilled remains in the ocean or on the beach. In addition, the oil that was recovered may have harmed wildlife before being cleaned up. In total, 124 animals (birds, mammals, herptiles) were found to be oiled, and only 36 survived. The second ruptured pipeline released less oil into the ocean, but there is currently no estimate for how many gallons. Cleanup crews for the second pipeline recovered 176-236 gallons of oil from the ocean, and no oiled wildlife was observed.
Both pipelines have been emptied, and they are no longer in operation. However, the pipeline operators appear to be intent on repairing the pipelines and using them in the future. The Pipeline Hazardous Materials Safety Administration is reviewing permanent repair plans for the pipelines. Please direct any questions about this process to phmsa.publicaffairs@dot.gov.
LATEST UPDATE as of 1/11/22
The agencies tasked with responding to the oil spill (U.S. Coast Guard, California Department of Fish & Wildlife, Orange County, and San Diego County), have ended their cleanup operations at all Orange County and San Diego County beaches. Tragically, a rupture was discovered in a separate but nearby pipeline on January 2, 2022. Crews were deployed to clean up the oil sheen, and protective booms were placed at the entrances to Orange County wetlands to absorb any floating oil. It is reported that no oil from the second pipeline rupture has reached the beaches. At this time, no fisheries closures have been recommended by the Office of Environmental Health Hazard Assessment.
The breach points in both pipelines have been identified and are being repaired. The remaining oil in the pipelines will be evacuated once repairs are completed. Cleanup crews will remain on call for an undetermined amount of time to respond to new incidents of oil sheens or tar balls. Oil and tar ball sightings should be reported to the National Response Center (1-800-424-8802) and California Office of Emergency Services (1-800-852-7550). For additional information about the oil spill, email ocoilspillinv@gmail.com
After the Orange County Oil spill released over 25,000 gallons of oil in early October, the Office of Environmental Health Hazard Assessment (OEHHA) recommended the closure of both commercial and recreational fishing to the California Department of Fish and Wildlife. The recommendation suggested a moratorium that would encompass the area from Huntington Beach to Dana Point. As of October 3rd, the closure prohibited the take of all fish and shellfish from an area that included over 20 miles of California coastline, with the boundary reaching 6 miles out to sea. The OEHHA had identified “that the threat to public health from consuming fish in the affected area was likely” and a few days after the original closure began, the CDFW expanded the prohibited territory to include bays and harbors from Seal Beach to San Onofre State Beach.
From October 14 to November 3, the OEHHA sampled seafood along this 650 square mile area to measure and evaluate polyaromatic hydrocarbon levels. PAHs are harmful chemicals found in oil and can accumulate along marine food chains, specifically in fish and shellfish caught for human consumption, “causing increased risk to cancer and other adverse health conditions.”
Three days ago, after extensive testing, the OEHHA announced that as of November 29, “there is no further risk to public health from seafood consumption in the affected area.” Following the OEHHA recommendation, Director Bonham of the CDFW signed a declaration lifting the ban on fisheries allowing fishing to resume no later than midday on November 30, 2021.
Beach and shoreline cleanup activities in Orange and Sand Diego counties are winding down as most beaches impacted by the spill have been deemed clear of oil by the spill response agencies (see here for how they determine this). There are still two segments of coastline in Orange County and three in San Diego County where there are ongoing cleanup activities. The US Coast Guard and Office of Spill Prevention and Response will respond to any new reports of oil on the coastline even at beaches where cleanup operations have ceased.
LATEST UPDATE as of 10/29/21
It has now been nearly 3 weeks since the Orange County oil spill.
Monitoring and cleanup continues by the Unified Command. More than 5,000 gallons of oil have been recovered by skimmers and over half a million pounds of oily sand and debris have been removed thus far. Based on a recently released water quality report, there appears to be very little detectable toxins in the water and all beaches and harbors are now open. Heal the Bay strongly believes that more monitoring is needed for the affected area and we encourage all beachgoers to continue checking the Beach Report Card before heading to the water.
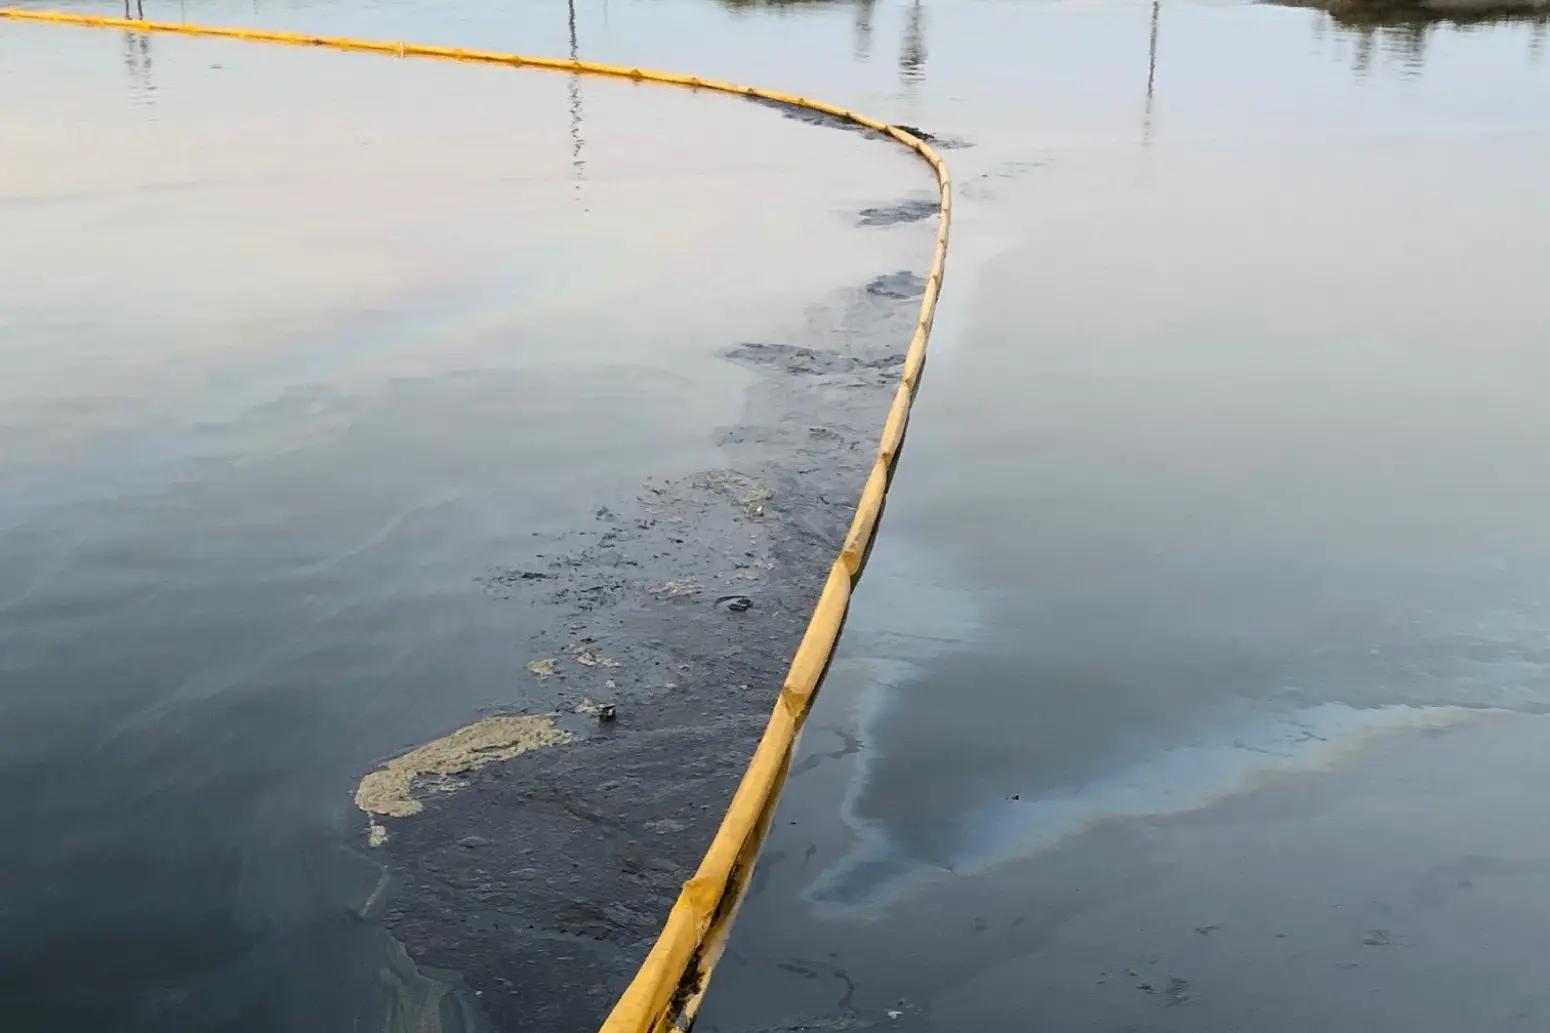
The Talbert Marsh still has floating barriers in place, but all other barriers have now been removed. Boat decontamination stations are available in harbors and all affected boats can be cleaned at the expense of the responsible party. The oiled wildlife that were recovered alive are doing well, and fewer in number than originally feared. Of the 33 oiled birds recovered alive, 20 have already been released. The total number of animals affected is just under 100 and includes birds, marine mammals, and fish.
Tar balls still may occur on beaches, and can be reported to CDFW at tarballreports@wildlife.ca.gov. Questions still remain about when and how the damage to the pipeline occurred, the exact amount of oil spilled, when and how the response began and how effective that response has been in properly informing and protecting the public. It does appear that less oil was spilled than the first estimates, and the minimum estimate is now just over 25,000 gallons in total.
Orange County beaches are open, but please be cautious.
Orange County officials re-opened all beaches on Monday, October 11 after a week-long closure due to the oil spill. The decision to open the beaches appears to be based on a water quality report recently conducted by a third-party contractor. They collected water samples and measured the amount of harmful petroleum compounds present in the water. All sampling locations showed non-detectible amounts of petroleum compounds, and one site at Bolsa Chica State Beach had a non-toxic level of certain compounds.
While the results are encouraging, Heal the Bay believes this report alone does not provide enough information to confidently re-open beaches, and we would like more information before we recommend people head out to the beach. Therefore, we continue to have an advisory listed on our Beach Report Card for Orange County beaches. Here are some facts about the report that we would like you to consider before going in the water:
The report only includes water quality data. Given that petroleum-related fumes pose a health risk to humans (page 2 of report), we would like to see air samples taken as well.
The data in the report is only from one day of sampling. The City of Huntington Beach has stated that monitoring will take place twice a week, and results will be posted on their oil spill website.
Only Huntington Beach beaches were sampled. We would like to see data from every beach along the Orange County coast impacted by the spill.
If you do decide to go to the beach, please do the following:
Avoid contact with visible oil on the sand or in the water.
It began with reports from community members smelling gas on Friday afternoon, and evidence of a visible oil slick on the ocean surface by Saturday. The official announcement of the spill came later Saturday evening: 126,000 gallons of crude oil gushed from a seafloor pipe into the surrounding ocean. The pipeline (owned by Amplify Energy) transports crude oil from the offshore oil platform Elly, located off the coast of Orange County in federal waters, to the shoreline in Long Beach. According to the LA Times, US Coast Guard criminal investigators are now looking more closely into the events leading up to the spill and potential negligence in the delayed response.
Oil spills are terrifyingly toxic to public health and marine life. Beaches are closed, and dead and injured birds and fish are already washing on shore. Marine mammals, plankton, fish eggs, and larvae are impacted too, as this toxic crude oil mixes with the ocean water, spreading both across the water surface and down into deeper water. As of 1:45 PM on October 5, only 4,700 gallons of the 126,000 spilled gallons had been recovered. Sadly this oil has also reached the sensitive and rare coastal wetlands at Talbert Marsh, a critical natural environment not only for wildlife habitat, but also for improving water quality by naturally filtering contaminants from water that flows through; however, this wetland cannot filter out oil pollution on such a scale.
(Photo by City of Huntington Beach)
Major oil spills keep happening because oil companies prioritize profits over the health of people and the environment. This is evidenced by the fact that the oil industry has continuously sought to skirt regulations and loosen up restrictions on oil extraction. The danger posed by the oil industry’s pattern of reckless behavior is augmented when you consider that much of the oil infrastructure in California is decades old and deteriorating. This is the second major pipeline leak in 6 years. The last one in 2015 was the Refugio oil spill that resulted in 142,000 gallons of oil damaging our coastline in Santa Barbara.
Oil spills are part of a much larger pollution problem. The impacts of fossil fuels are felt at every stage, from extraction to disposal.
Major oil spills are disastrous, yet somewhat intermittent. But air pollution from fossil fuel extraction sites and oil refineries located on land have a harmful impact every single day for fenceline neighborhoods. Low-income communities and communities of color are exposed to disproportionate health and safety risks due to a history of abundant drilling within close proximity to where community members live, work, and go about daily life.
So, what does all this risky drilling get us? In the end we are left with products like gasoline, which contributes to the climate crisis when burned, or plastics that are used once (or not at all) and then thrown “away,” ultimately ending up right back here, polluting our neighborhoods and ocean.
WHAT WE DON’T KNOW
It is still unclear what caused the oil spill as well as exactly when it started and when it stopped. Divers are conducting an ongoing investigation, which will give us more information about what caused the rupture that led to thousands of barrels of oil spilling into the Pacific Ocean.
Crude oil is a mixture of toxic chemicals including benzene and other carcinogens, and oil can come in a few different forms, which can have different impacts on the ecosystem. Unfortunately, we do not yet know the type of oil that was spilled, and proprietary trade laws allow oil companies to keep their oil and chemical mixtures a secret. We also do not know how cleanup progress will be monitored and if water quality testing will be included in that process or not. Based on previous spills, we expect the beaches to be closed for several weeks, and we expect environmental harm to last for years.
WHAT NOT TO DO
At this time, the best thing you can do is to stay away from the oil spill area for your own safety.
Stay clear of oil-fouled and closed beaches, stay out of the water, and keep boats far from the existing oil slick. As of October 4, Newport Harbor and Dana Point Harbor are closed, and a beach closure has been put into effect in Huntington Beach. Allow plenty of space for rescue workers and cleanup crews from the US Coast Guard and California Department of Fish and Wildlife Office of Spill Prevention and Response (CDFW-OSPR) to access and work at the spill site. If you see any injured or oiled wildlife, DO NOT try to intervene on your own. Instead, report the animal to the Oiled Wildlife Care Network at 1-877-823-6926.
CDFW has issued an emergency fisheries closure between Anaheim Bay and San Onofre Beach. The closure extends 6 to 10 miles offshore. Any take of fish from this area is prohibited until further notice and CDFW is carefully patrolling the area. If you are an angler, check this detailed description and map to ensure you are staying outside the fishing closure for your own health and safety. Shellfish and fish may become contaminated from the oil and other chemicals in the water. Eating fish and shellfish from the contaminated area may make you sick, and it’s also hazardous to be out there fishing because of possible exposure to harmful fumes from the spill.
Heal the Bay’s Science and Policy team is working on a public call to action with specific policy demands that we will share soon on our blog and on our Twitter, Instagram, and Facebook channels. In the meantime, there is still a lot that you can do while keeping a safe distance from the oil spill.
If you are local, you can volunteer with spill cleanup efforts. The California Department of Fish and Wildlife is soliciting volunteers from the public to assist in volunteer tasks with the Unified Command.
You can contact the UC Davis Oiled Wildlife Care Network at 1-877-823-6926 to report oiled wildlife. Currently, only trained responders may assist in the cleanup efforts. However, if you would like to sign up to be trained for future emergencies, you can fill out this OSPR Incident Volunteer Form, or call the volunteer hotline at 1-800-228-4544 for more information.
You may encounter tarballs on San Diego and Orange County beaches. Oil contains hazardous chemicals, and for safety reasons we recommend not handling tarballs or any oil yourself. If you encounter tarballs, contact cleanup teams at tarballreports@wildlife.ca.gov for assistance.
Stay informed! Review the news and reports, follow the Southern California Spill Response for information and updates, and keep tabs on the Los Angeles Times, which is doing in-depth and up to date reporting during this emergency.
We encourage you to support and follow these organizations doing great work to rescue and protect wildlife from the oil spill and champion clean water and healthy wetlands locally in Orange County:
We suggest you follow and support these organizations who are tirelessly taking on the big fight to phase out oil drilling in our ocean, neighborhoods, and everywhere else:
This is NOT an exhaustive list; there are many organizations and individuals doing this hard work. If your group is working on the spill or fighting big oil and would like to be added to the above list, contact us.
THE TAKEAWAY
If we continue to rely on fossil fuels, oil spills and air pollution are inevitable and their impacts will continue to be devastating. The only solution is to shut down this dirty industry and protect ourselves and our environment through a just transition away from an extractive fossil fuel economy.
On the heels of the 17-million-gallon sewage spill in the Santa Monica Bay on July 11-12, Heal the Bay and the World Surf League—two Santa Monica-based organizations—are partnering to expand Heal the Bay’s Beach Report Card with NowCast to give beachgoers more information, more swiftly, about potential risks from poor ocean water quality at California’s most popular beaches and surf spots.
Heal the Bay and the World Surf League (WSL) are announcing a multi-year partnership in support of Heal the Bay’s Beach Report Card, activating local surfers to protect the health of 150 million beachgoers in California, and increasing surfing community outreach through social media and local competition events in California.
Summer is here, temperatures are hot, and more people are flocking to the beach. With roughly a thousand miles of shoreline, California has one of the longest and also most diverse coasts of any state in the USA. California offers an incredible array and variety of beaches and waves. Several offer pristine bays with 30-feet visibility underwater, others iconic views and world class waves.
While the waves may look clear, many beachgoers have no idea they might be swimming in a bacteria-polluted area, especially near piers, storm drains, and enclosed harbors with poor water circulation. One in 25 beachgoers will get sick swimming or surfing in polluted water near a flowing storm drain. Youth and seniors are particularly vulnerable to illnesses related to bacterial pollution.
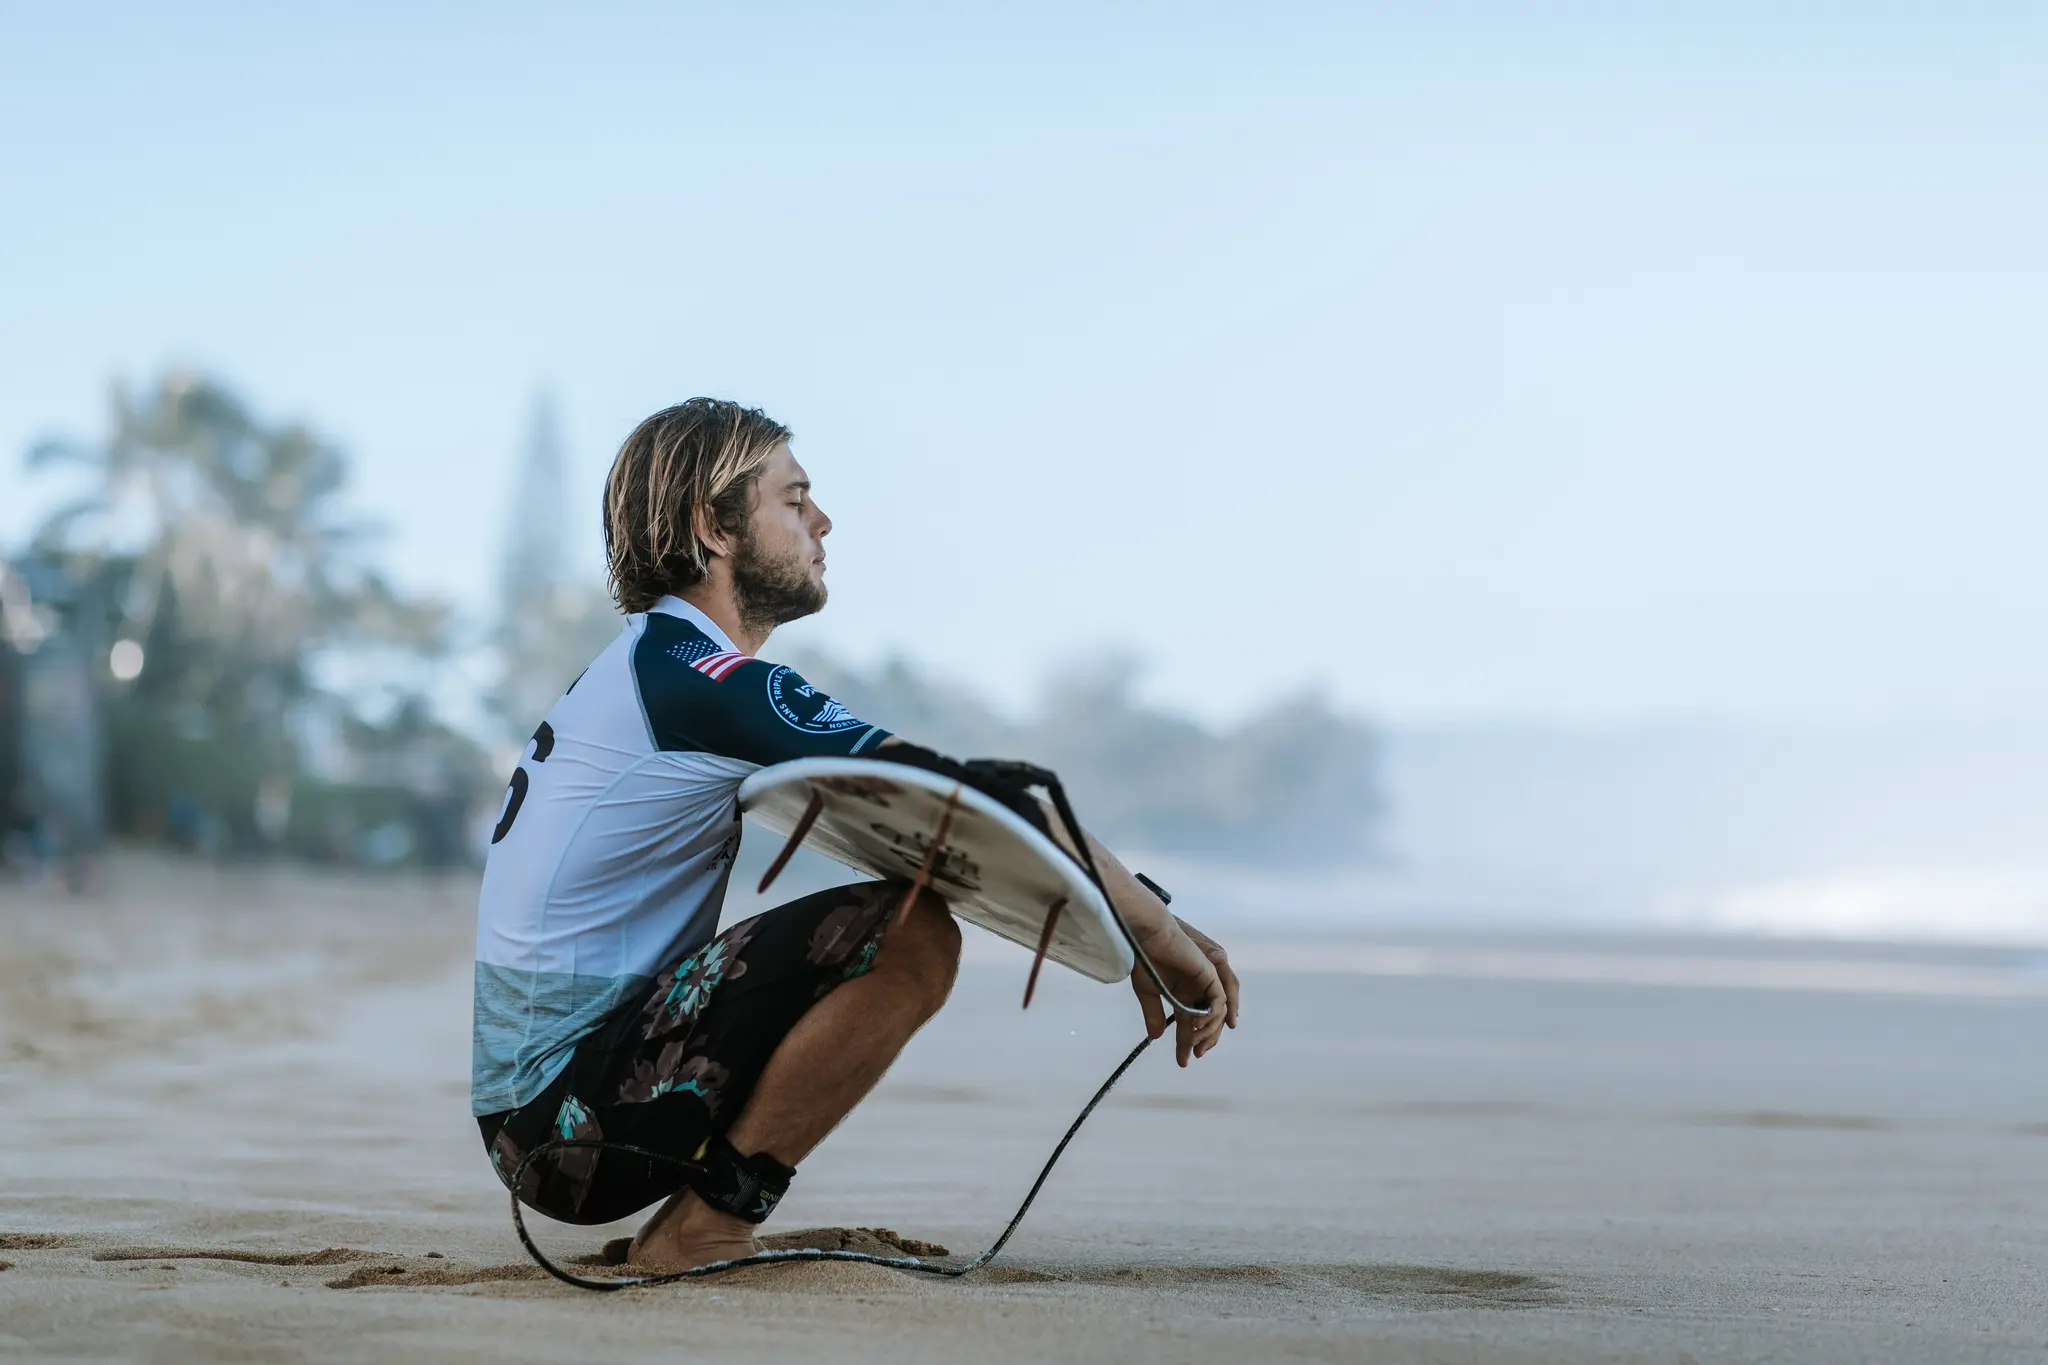
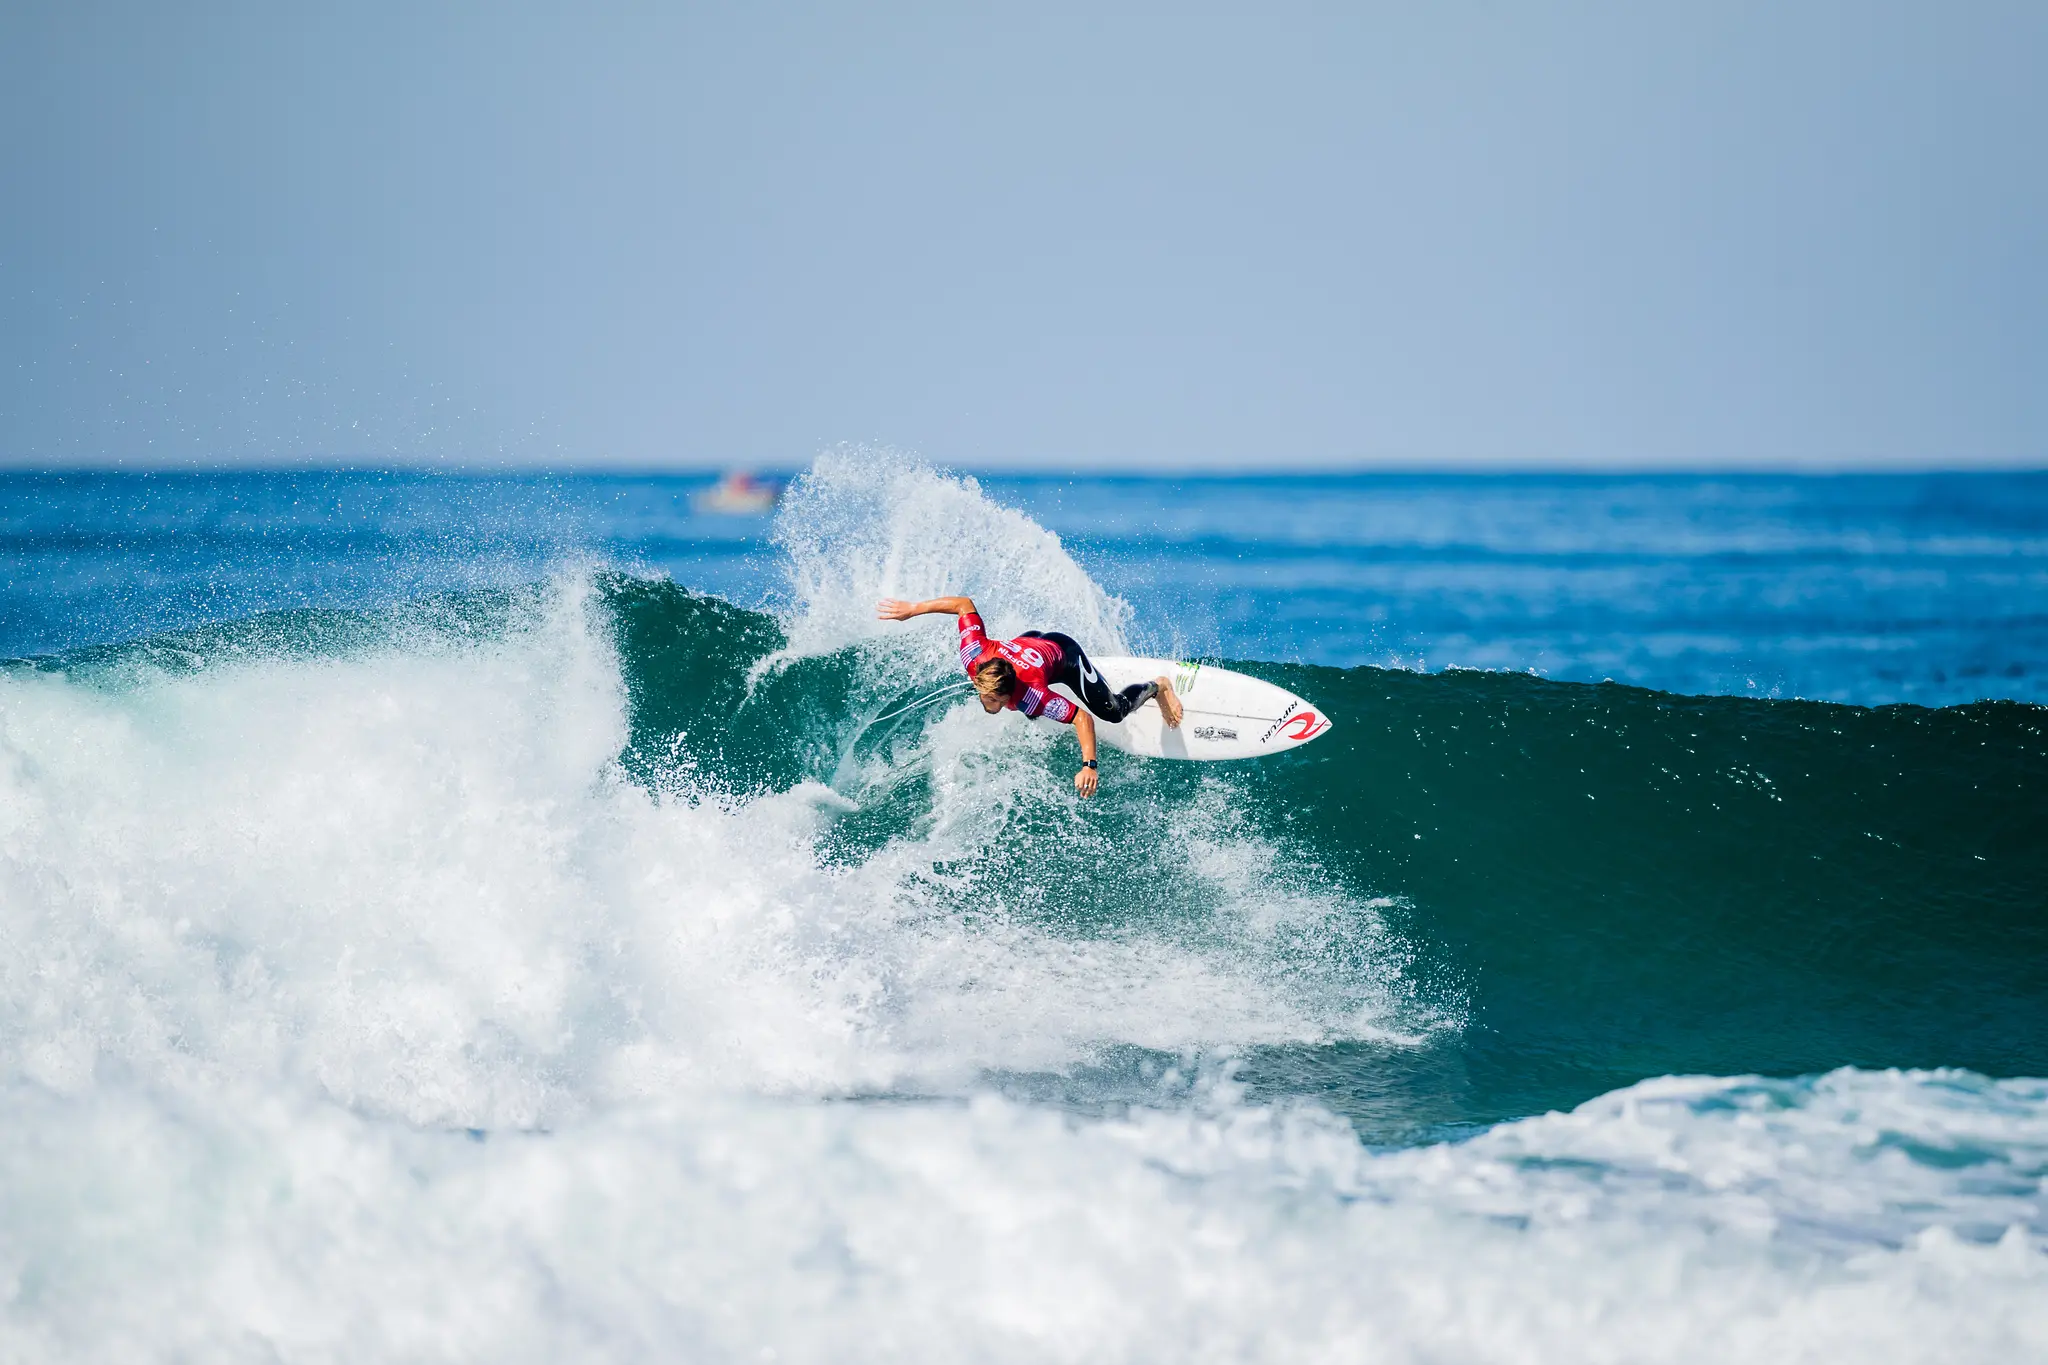
“As a surfer, I have spent a ton of time in the water since I was a little kid. The water quality at my local beaches is something I have always been observant of. Unfortunately, there have been many times where the water quality has seemed very low and I’ve gotten sick from surfing in dirty water. I’m thrilled the World Surf League is partnering with Heal the Bay on the Beach Report Card for California. Everyone deserves access to clean water to surf, swim, and enjoy this precious resource – our one ocean!” says Conner Coffin, WSL Championship Tour surfer.
The Beach Report Card is Heal the Bay’s education, advocacy, and public health notification tool for people concerned about the water quality at their favorite beaches across the state of California. The latest beach water quality grades are displayed alongside historical trends. The program also has science and policy initiatives to improve water quality, advance water quality testing methods, and ensure beachgoers have equitable and immediate access to beach water quality information through environmental and public health legislation and regulation.
Dr. Shelley Luce, Heal the Bay CEO & President says, “We’re excited to announce our partnership with the World Surf League. Clean ocean water has multiple benefits. It sustains healthy ecosystems and thriving wildlife, it mitigates impacts from the climate crisis, and it provides a safe place to enjoy the outdoors and cool off. We thank our partners at the World Surf League for working together with us to protect clean water starting in Santa Monica, stretching up and down the California coastline, and rippling out globally.”
The World Surf League is sponsoring the Beach Report Card for three-years, supporting the popular Annual Report, which highlights the coveted Honor Roll list as well as the notorious Beach Bummers list. The World Surf League is also investing in the growth of NowCast, Heal the Bay’s daily water quality prediction program.
“The WSL is incredibly proud to partner with Heal the Bay to provide tools and resources such as the Beach Report Card for all ocean lovers to be informed about water quality prior to heading to their favorite beach. As a global sports league, the future of our sport depends on a healthy ocean. Our focus as a league is to protect the ocean and beaches by inspiring climate action, preventing pollution, and conserving our coasts through campaigns like We Are One Ocean,” said Erik Logan, WSL CEO.
Heal the Bay is expanding NowCast to include 40-50 beaches over the next three years.
About Heal the Bay and the Beach Report Card
Heal the Bay is an environmental nonprofit dedicated to making the coastal waters and watersheds in Greater Los Angeles safe, healthy, and clean. We use science, education, community action, and advocacy to fulfill our mission.
Heal the Bay’s Beach Report Card is the only comprehensive analysis of coastline water quality in California. We provide water quality grades for more than 700 beaches weekly from Washington to Mexico during the peak beach-going season, with approximately 500 locations in California. Each location is assigned an A to F grade based on the health risks of swimming, surfing, and entering the water at that location.
Established in 1976, the World Surf League is the home of the world’s best surfing. A global sports, media and entertainment company, the WSL oversees international tours and competitions, a studios division creating over 500+ hours of live and on-demand content, and via affiliate WaveCo, the home of the world’s largest high performance, human-made wave. Headquartered in Santa Monica, California, the WSL has regional offices in North America, Latin America, Asia Pacific, and EMEA. The WSL is dedicated to changing the world through the inspirational power of surfing by creating authentic events, experiences, and storytelling to inspire a growing, global community to live with purpose, originality, and stoke.
Heal the Bay releases scientific reports and annual bacterial-pollution rankings for hundreds of beaches in California and dozens of freshwater recreation areas in Los Angeles County during 2020 – 2021.
The thirty-first annual Beach Report Card study assigns A-to-F letter grades for 500 California beaches based on levels of fecal-indicator bacterial pollution in the ocean measured by County health agencies. In addition, we ranked water quality at 28 freshwater recreation areas in Los Angeles County during summer 2020 and shared findings from the third annual River Report Card.
Highlights from the Beach Report Card
Hotter days are here! Beach days and river trips are at an all-time high. The good news is California beaches had excellent water quality in summer 2020. 93% of the California beaches monitored by Heal the Bay received an A or B grade, which is on par with the five-year average.
Even so, our scientists remain deeply concerned about ocean water quality. Polluted waters pose a significant health risk to millions of people in California. People who come in contact with water with a C grade or lower are at a greater risk of contracting illnesses such as stomach flu, ear infections, upper respiratory infections, and rashes.
Beaches and rivers usually have high-risk water quality following a rain event. Less rain typically means that reduced amounts of pollutants, including bacteria, are flushed through storm drains and rivers into the ocean. However, this wasn’t the case this past winter. Rainfall across coastal counties in California was 41 percent lower than the historical average. Yet only 57% of California beaches had good or excellent grades during wet weather, which was worse than average. The lower grades are in part due to the high percentage of “first flush” samples in the wet weather dataset.
“As a surfer, I have spent a ton of time in the water since I was a little kid. The water quality at my local beaches is something I have always been observant of. Unfortunately there have been many times where the water quality has seemed very low and I’ve gotten sick from surfing in dirty water. I’m thrilled the World Surf League is partnering with Heal The Bay on the Beach Report Card for California. Everyone deserves access to clean water to surf, swim, and enjoy this precious resource – our one ocean!” –Conner Coffin
California’s Beach Bummer List
Heal the Bay’s Beach Bummer List ranks the most polluted beaches in California based on levels of harmful bacteria in the ocean. The 2020-2021 Beach Bummer List includes beaches in San Diego, San Mateo, Santa Barbara, Los Angeles, Humboldt, and Santa Cruz Counties.
Tijuana Slough National Wildlife Refuge, Tijuana River mouth – San Diego County
Foster City, Erckenbrack Park – San Mateo County
Capitola Beach, west of jetty – Santa Cruz County
Foster City, Gull Park – San Mateo County
Marina del Rey Mother’s Beach, between Lifeguard Tower and Boat dock – Los Angeles County
Tijuana Slough National Wildlife Refuge, 3/4 miles north of Tijuana River – San Diego County
Clam Beach County Park at Strawberry Creek – Humboldt County
Foster City, Marlin Park – San Mateo County
Candlestick Point, Windsurfer Circle – San Francisco County
East Beach at Mission Creek – Santa Barbara County
California’s Beach Honor Roll List
Heal the Bay’s Honor Roll List includes 35 California beaches that scored perfect water quality grades year-round (compared to 42 beaches in the prior year). Most beaches on the Honor Roll are in Southern California because many Counties in Central California and Northern California do not sample frequently enough during the winter months. Orange County had the most beaches on the Honor Roll. Los Angeles, Ventura, San Luis Obispo, San Diego, San Francisco, Santa Barbara, and Alameda Counties also had beaches with perfect water quality grades.
Crown Beach, at Sunset Rd. – Alameda County
Royal Palms State Beach – Los Angeles County
Leo Carrillo Beach, at Arroyo Sequit Creek – Los Angeles County
Puerco State Beach, at creek mouth – Los Angeles County
Las Flores State Beach, at Las Flores Creek – Los Angeles County
Broad Beach, at Trancas Creek – Los Angeles County
Escondido State Beach, at Escondido Creek – Los Angeles County
Nicholas Beach, at San Nicholas Canyon Creek – Los Angeles County
Newport Bay, Promontory Point – Orange County
Crystal Cove (CSDOC) – Orange County
Newport Beach, at Orange Street – Orange County
Newport Beach, at 52nd/53rd Street – Orange County
Balboa Beach Pier – Orange County
Balboa Beach, The Wedge – Orange County
Crystal Cove – Orange County
1000 Steps Beach, at 9th St. – Orange County
North Aliso County Beach – Orange County
Treasure Island Beach – Orange County
Carlsbad, at Encina Creek – San Diego County
Carlsbad, at Palomar Airport Rd. San Diego County
Solana Beach, Tide Beach Park at Solana Vista Dr. – San Diego County
Guadalupe Dunes – Santa Barbara County
El Capitan State Beach – Santa Barbara County
China Beach, at Sea Cliff Ave. – San Francisco County
Ocean Beach, at Lincoln Way – San Francisco County
Sewers at Silver Shoals Dr. – San Luis Obispo County
Morro Bay City Beach, at Atascadero – San Luis Obispo County
Pismo State Beach, 330 yards north of Pier Ave. – San Luis Obispo County
Hollywood Beach, at Los Robles St. – Ventura County
C.I. Harbor, at Hobie Beach Lakeshore Dr. – Ventura County
Oil Piers Beach, south of storm drain – Ventura County
Silverstrand, at Sawtelle Ave. – Ventura County
Ormond Beach, 50 yards north of Oxnard Industrial drain – Ventura County
Ormond Beach, at Arnold Rd. – Ventura County
Faria County Park, at stairs – Ventura County
Highlights from the River Report Card
Heal the Bay graded 28 freshwater recreation areas in Los Angeles County within the L.A. River, San Gabriel River, and Malibu Creek Watersheds during summer 2020. 70% of the freshwater grades indicated a low risk of illness, 17% indicated a moderate risk of illness, and 13% indicated a high risk of illness.
L.A.’s Freshwater Fails List
Top 9 river recreation sites in Los Angeles County that are high-risk places to swim or boat.
1. Tujunga Wash at Hansen Dam – Upper L.A. River Watershed
2. L.A. River at Rattlesnake Park – L.A. River Watershed: Recreation Zones
3. San Gabriel River Below North and West Forks – San Gabriel River Watershed
4. L.A. River at Middle of Sepulveda Basin Recreation Zone – L.A. River Watershed: Recreation Zones
5-6. Bull Creek – Upper L.A. River Watershed
5-6. Lake Balboa Boat Ramp – Upper L.A. River Watershed
7. Lake Balboa Outlet – Upper L.A. River Watershed
8. L.A. River at Balboa Blvd. – L.A. River Watershed: Recreation Zones
9. Switzer Falls – Upper L.A. River Watershed
L.A.’s Freshwater Honor Roll List
Top 10 river recreation sites in Los Angeles County that are low-risk places to swim or boat.
1-8. San Gabriel River East Fork at Graveyard Canyon – San Gabriel River Watershed
1-8. L.A. River at Benedict St. (formerly Frogspot) – L.A. River Watershed: Recreation Zones
1-8. Gould Mesa – Upper L.A. River Watershed
1-8. Hansen Dam Lake – Upper L.A. River Watershed
1-8. San Gabriel River Lower North Fork – San Gabriel River Watershed
1-8. Sturtevant Falls – Upper L.A. River Watershed
1-8. San Gabriel River Upper North Fork – San Gabriel River Watershed
1-8. Big Tujunga Creek at Vogel Flats – Upper L.A. River Watershed
8-10. San Gabriel River Upper East Fork – Upper L.A. River Watershed
8-10. San Gabriel River Upper West Fork – San Gabriel River Watershed
Equity and Access
The COVID-19 pandemic, a record-setting wildfire season, and extreme heat during summer 2020 highlighted the dire need for equity in our waters, and exposed major systemic failures; open spaces, including beaches and rivers, are not equally accessible to all people. Low-income communities of color tend to be the most burdened communities, bearing the brunt of environmental pollution and limited access to open space.
“A day at the beach and the river shouldn’t make anyone sick,” said Dr. Shelley Luce, President and CEO of Heal the Bay. “With the closures, stress, and uncertainty of the pandemic, it is no surprise that people sought out our local waters in 2020. While we’re thrilled about the excellent water quality across California, our marine ecosystems are still threatened by climate change and other pollution sources. This is alarming as we expect people to increasingly seek out ocean shorelines and freshwater swimming holes to cool off as temperatures rise. Heal the Bay’s Beach Report Card and River Report Card give access to the latest water quality information and are a critical part of our science-based advocacy work in support of strong environmental and public health policies that improve the health and resilience of our ocean, our rivers, and our communities.”
Avoid shallow, enclosed beaches and freshwater areas with poor water circulation.
Swim at least 100 yards away from flowing storm drains, creeks, and piers.
Stay out of the water for at least 72-hours after a rain event.
Follow all local health and safety regulations, including all local pandemic-related regulations.
Check in with the lifeguard or ranger on duty for more information about the best places to swim.
About Heal the Bay
Heal the Bay is a 501(c)3 nonprofit organization founded in 1985. We use science, education, community action, and advocacy to fulfill our mission to protect coastal waters and watersheds in Southern California. Heal the Bay Aquarium, located at the Santa Monica Pier, welcomes 100,000 guests annually and hosts a variety of public programs and events that highlight local environmental issues and solutions. Learn more at healthebay.org and follow @healthebay on social media.
About Beach Report Card
Beach Report Card with NowCast, in partnership with World Surf League, is Heal the Bay’s flagship scientific water quality monitoring program that started in the 1990s. For thirty years, the Beach Report Card has influenced the improvement of water quality by increasing monitoring efforts and helping to enact strong environmental and public health policies. Learn more at beachreportcard.org and download the free app on iPhone and Android devices.
The Beach Report Card is made possible in part through generous support from SIMA Environmental Fund, Swain Barber Foundation, SONY Pictures Entertainment, and World Surf League.
About River Report Card
Currently, there is no statewide water quality monitoring mandate for rivers and streams in California, like we have for the ocean as a result of the Beach Report Card. Heal the Bay started the River Report Card in 2017 to push for new public health protections for freshwater areas in addition to serving the immediate need for increased public awareness about the risks at popular freshwater recreation areas in Los Angeles County. Learn more at healthebay.org/riverreportcard.
The River Report Card is made possible in part by generous support from Alice C. Tyler Perpetual Trust and Garfield Foundation.
Las playas de California tuvieron una excelente calidad de agua durante los meses de verano del 2020. De más de 500 playas en todo el estado, el 93% obtuvieron buenas calificaciones (A y B). Las precipitaciones del año pasado estuvieron drásticamente por debajo del promedio, lo que generalmente conlleva a una mejor calidad del agua debido a las cantidades reducidas de contaminantes que fluyen hacia el océano. Sin embargo, las calificaciones durante la temporada de lluvias fueron peores al promedio en este año, probablemente debido al hecho de que la mayoría de los datos durante la temporada de lluvias se recopilaron cuando se registraron las primeras lluvias (que son las más importantes) las cuales llevan más contaminación.
• La desembocadura del río Tijuana y la playa que se encuentra a menos de una milla al norte se encuentran en nuestra lista de las Peores Playas. Estas playas se ven afectadas por las aguas residuales que fluyen desde el río Tijuana y de la Planta de Tratamiento Punta Bandera. Las aguas residuales tienen su origen en la infraestructura del alcantarillado deteriorado e insuficiente en la ciudad de Tijuana.
• El condado de San Mateo continúa luchando con la calidad del agua, ya que tres playas en el área de Foster City se encuentran en la lista de las Peores Playas: Erckenbrack Park, Gull Park y Marlin Park. Erckenbrack Park apareció en la lista de las peores playas el año pasado junto con otras cinco playas del condado de San Mateo. Cuatro de esas peores playas del 2019 no fueron monitoreados en absoluto en 2020. Esto es alarmante ya que este tramo de costa ha experimentado altos niveles de contaminación fecal y es muy popular entre los bañistas que ahora no tienen información sobre la potencial contaminación.
• Capitola Beach en el Condado de Santa Cruz es la playa número tres en la lista de este año. El arroyo de Soquel Creek desemboca en el océano cerca de esta playa, descargando bacterias contaminantes de toda la cuenca. Esta playa ha sido un fastidio desde que se lanzó el Boletín de Calificaciones de Playas.
• La unica Peor Playa del condado de Los Ángeles es la palaya Mother’s Beach en Marina Del Rey, que no es ajena a la lista de las playas más contaminadas del estado. Esta playa está encerrada y experimenta poca acción de las olas, por lo que la contaminación bacteriana no se elimina facilmente.
• Clam Beach en el condado de Humboldt ha recibido el estatus de la Peor Playa en siete de los últimos 11 años. La calidad del agua en esta playa del norte de California se ve afectada negativamente por la escorrentía agrícola que fluye hacia el océano a través de los arroyos de Patrick Creek y Strawberry Creek.
• El Candlestick Point de San Francisco en Windsurfer Circle regresa a la lista después de una pausa de siete años. Candlestick Point se encuentra en la Bahía de San Francisco, y aunque no es un área encerrada, es probable que no experimente tanta circulación de agua como una playa de mar abierto.
• East Beach en Santa Bárbara está haciendo su primera aparición en la lista de las Peores Playas. La contaminación bacteriana del área de Santa Bárbara fluye en el océano hacia la playa de East Beach a través del arroyo de Mission Creek.
Las playas de Oregon no fueron monitoreadas con la frecuencia suficiente para recibir una calificación este verano, y no se monitorearon sus playas durante los meses de invierno. Solo cuatro condados de Oregon recibieron calificaciones durante la temporada de lluvias, que fueron mediocres y muy por debajo del promedio en temporada lluviosa del estado de 82% que recibieron calificaciones de A y B.
Las calificaciones durante la temporada seca de verano en el estado deWashington fueron excelentes y el 96% de las playas recibieron calificaciones de A y B. Las calificaciones en temporada lluviosa fueron excepcionales y por encima del promedio, con un 91% que recibieron calificaciones de A y B. Las playas del estado de Washington no fueron monitoreadas durante los meses de invierno, por lo que no se pudieron calcular las calificaciones durante la temporada seca de invierno.
El verano 2020 fue el primer año en que las playas de Tijuana, México se incluyeron en el Boletín de Calificaciones de Playas. Las playas de El Faro y El Vigía recibieron una B para las calificaciones durante la temporada seca de verano, mientras que Playas Blanca recibió una D. Las calificaciones durante la temporada seca de invierno mostraron un patrón similar donde El Faro y El Vigía recibieron una D, y Playas Blanca recibió una F. Las tres playas recibieron F para la temporada lluviosa. Este tramo de costa recibe a millones de visitantes cada año y se ve muy afectado por la contaminación de las aguas residuales durante todo el año, incluso durante la temporada seca. La fuente principal de contaminación es la planta de tratamiento Punta Bandera ubicada al sur de Tijuana, que regularmente libera aguas residuales no tratadas o parcialmente tratadas al océano.
El Boletín de Calificaciones de Playas se enfoca en la calidad del agua de las playas océanicas. Sin embargo, monitorear la calidad del agua en los sitios de agua dulce, como ríos, lagos y arroyos, y hacer que esa información esté disponible para el público también es importante para proteger la salud pública en sitios recreacionales. Heal the Bay creó el Boletín de Calificaciones de Ríos (River Report Card) para informar al público de la calidad del agua en nuestros ríos y arroyos. Heal the Bay recolecta muestras y analiza la calidad del agua en seis sitios recreacionales en el condado de Los Angeles, recopila datos de monitoreo de 22 stios adicionales del condado de Los Ángeles; y transforma los datos en grados codificados por colores de fácil comprensión. Antes de dirigirse a una área de recreación de agua dulce en el condado de Los Ángeles, consulte nuestro River Report Card en , que se actualiza regularmente durante los meses de verano.
Heal the Bay también patrocina el Proyecto de Ley 1066 de la Asamblea (Bloom) en California, que es el primer paso para garantizar que los sitios de recreación de agua dulce en el estado sean monitoreados para detectar contaminación fecal y que se informe a la comunidad.
For the seventh straight summer, Heal the Bay is posting daily water quality predictions for California Beaches at the Beach Report Card with NowCast. To make daily predictions, we use computer models to examine correlations between environmental conditions (such as temperature and tide) and historical bacteria concentrations. Our NowCast models then predict with a high accuracy how much bacteria could be present in the water given the current local conditions at the beach.
A day at the beach should not make anyone sick. That is why health officials across the state monitor water quality at the beach every week during the summer. And when officials detect high levels of bacteria, they issue a public health advisory. By the time traditional water quality samples are processed, a minimum of 18-24 hours have passed and the information is already outdated – and with samples taken only every 7 days, a weekly water quality grade may not provide the most useful or updated information as water quality can fluctuate rapidly. Heal the Bay believes that we need daily water quality information in order to better protect public health – our NowCast program does exactly that, issuing daily water quality information for 25 beaches.
NowCast predictions appear on the Beach Report Card website and app with the symbols seen below. A Blue “W+” symbol indicates that there is a low risk of illness by coming in contact with the water, and a Red “W-” symbol indicates that there is a high risk of illness by coming in contact with the water.
Head to beachreportcard.org to find daily predictions for 25 beaches across California. Or download our free app on your iOS or Android device to get daily predictions on-the-go.
Just in time for Memorial Day weekend, the unofficial start of summer 2021, we are excited to announce the 25 beaches in our NowCast program, with five new beaches added to the program in 2021:
Trinidad State Beach, Humboldt County *NEW
Luffenholtz State Beach, Humboldt County
Bolinas Beach at Wharf Road, Marin County
Aquatic Park, San Francisco
Ocean Beach at Balboa Street, San Francisco
Linda Mar Beach at San Pedro Creek, San Mateo County
Half Moon Bay State Beach, San Mateo County *NEW
Rio Del Mar, Santa Cruz County
Lover’s Point, Monterey County *NEW
Morro Bay at Atascadero Road, San Luis Obispo County
Hammonds Beach, Santa Barbara County *NEW
Promenade Park at C Street, Ventura County *NEW
Leo Carrillo, Los Angeles County
Venice Beach at Brooks Avenue, Los Angeles County
Venice Breakwater, Los Angeles County
Dockweiler/Toes Beach, Los Angeles County
El Porto, Los Angeles County
Manhattan Beach at 28th Street, Los Angeles County
Redondo Breakwater, Los Angeles County
Torrance Beach at Avenue I, Los Angeles County
Long Beach at 5th Place, Los Angeles County
Long Beach at 72nd Place, Los Angeles County
Seal Beach Pier, Orange County
Huntington Beach at Brookhurst Street, Orange County
Newport Beach at 38th Street, Orange County
Don’t see your beach on the map? Let us know if you have a beach we should consider for NowCast. We are continually refining and expanding this program and hope to cover more beaches in the future. Predicting water quality is complex and we want to make sure we get it right. This means we need access to a myriad of data sources in order to make accurate predictions, and when data are not readily available, we can’t make the prediction.
Communities looking to bring daily water quality predictions to their favorite beach spots can advocate for this cause in the following ways:
Advocate at town halls and city council meetings for increased funding toward ocean and environmental data observation, collection, standardization, and analysis programs.
Support Heal the Bay’s staff scientists efforts to expand monitoring programs and directly fund our work.
Stay informed about your local water quality and reach out to your representatives in California demanding improvements be made to protect public health and the environment.
If you can’t find NowCast predictions in your area, you can see the latest water quality grades issued to over 500 beaches on the Beach Report Card. In the meantime, we are working to expand NowCast, so check back soon to see if your favorite beach has water quality predictions.
For the sixth straight summer, Heal the Bay is posting daily water quality predictions for California Beaches on our Beach Report Card with NowCast.
A day at the beach should not make anyone sick. That’s why health officials across the state sample water at the beach weekly during the summer. And when officials detect high levels of bacteria, they issue a public health advisory.
The good news: by measuring the amount of bacteria in the water and sharing information with the public in real time, we can help you decide when and where it’s safest to go to the beach. Plus, it raises awareness about ocean pollution and brings much-needed attention to solving systemic waste and runoff issues.
The bad news: weekly samples aren’t enough. Water quality can fluctuate drastically from day to day, with real implications for people’s health. Heal the Bay believes that we need daily samples in order to better protect public health. In 2015, we launched our NowCast program within the Beach Report Card. NowCast supplements the weekly grades provided by public health officials by bringing accurate daily predictions to the public.
NowCast is able to predict concentrations of bacteria in the water on a daily basis, filling in the time gap of weekly bacteria sampling. NowCast consists of computer models that examine correlations between environmental conditions (such as temperature and tide) and historical bacteria concentrations. Our models then predict how much bacteria could be present in the water given the current local conditions at the beach.
NowCast predictions appear on the Beach Report Card with the symbols seen below. A Blue “W+” symbol indicates that there is a low risk of illness by coming in contact with the water, and a Red “W-” symbol indicates that there is a high risk of illness by coming in contact with the water.
Good Water Quality
Poor Water Quality
Head to beachreportcard.org to find daily predictions for over 25 beaches across California. Or download the free app on your iOS or Android device to get daily predictions on-the-go.
List of Beaches With Daily NowCast Water Quality Predictions
Ocean Beach (Balboa St.), San Francisco
Ocean Beach (Lincoln Way), San Francisco
Candlestick Point (Windsurfer Circle), San Francisco – NEW
Main Beach (Boardwalk), Santa Cruz County
Leo Carrillo, Los Angeles County – NEW
Will Rogers (Temescal Canyon), Los Angeles County
Will Rogers (Santa Monica Canyon), Los Angeles County
Santa Monica (Pico Ave.), Los Angeles County – NEW
Venice Beach Pier, Los Angeles County
Dockweiler/Toes Beach, Los Angeles County
El Porto, Los Angeles County – NEW
Manhattan Beach (28th St.), Los Angeles County
Hermosa Beach Pier, Los Angeles County – NEW
Redondo Breakwater, Los Angeles County
Redondo Beach Pier, Los Angeles County
Torrance Beach (Avenue I), Los Angeles County – NEW
Long Beach (72nd Place), Los Angeles County
Seal Beach (1st), Orange County – NEW
Seal Beach Pier, Orange County
Huntington Beach (Brookhurst St.), Orange County
Newport Beach (52nd), Orange County – NEW
Newport Beach (38th), Orange County
Aliso Creek Outlet, Orange County – NEW
Monarch Beach (Salt Creek Outlet), Orange County – NEW
Doheny State Beach, Orange County
San Clemente Pier (Lifeguard Tower), Orange County
Don’t see your beach on the map? We’re working on it! Predicting water quality is complex and we want to make sure we get it right. This means we need access to a myriad of data sources in order to make accurate predictions, and when data are not readily available, we can’t make the prediction.
If you’re looking to help monitor and improve the water quality at your favorite beach spots, here’s a few things you can do:
Advocate at town halls and city council meetings for increased funding toward ocean and environmental data observation, collection, standardization, and analysis programs.
Support Heal the Bay’s staff scientists efforts to expand monitoring programs and directly fund our work.
Stay informed about your local water quality and reach out to your representatives in California demanding improvements be made to protect public health and our natural environment.
If you can’t find daily NowCast predictions in your area, you can still see the latest water quality grades issued to over 500 beaches on the Beach Report Card Website. In the meantime, we are working to improve and expand the NowCast system so check back frequently to see if your favorite beach has water quality predictions.
Our 30th Anniversary of the annual Beach Report Card:
Thirty years ago people were getting sick from going in the ocean, and there was no way for them to know when or where they were at risk. Heal the Bay introduced the Beach Report Card in 1990-1991, a tool to help keep the public safe at the beach. It is also a powerful resource used to advocate for water quality policies and improvement projects.
Thirty years later, Heal the Bay is stoked to release the 30th annual Beach Report Card, because a day at the beach shouldn’t make anyone sick. This report assigns A-to-F letter grades for more than 500 California beaches, based on levels of bacterial pollution in the ocean.
So, what did our staff scientists find? Here are our major takeaways:
California beach water quality improved in 2019-2020, driven in large part by decreased rainfall. Rainfall across coastal counties in California was 12 percentage points lower than the historical average. Less rain means fewer pollutants, including bacteria, were flushed through storm drains and rivers into the ocean. Because of this pollutant flushing, only 65% of CA beaches received good or excellent grades during wet weather.
The notorious Beach Bummer list—a ranking of the ten most polluted beaches in the state—includes six bacteria-impaired beaches within San Mateo County. This is an unusually high number of beach bummers for a single county. The remaining four beach bummers are located in Southern California and are frequent pollution offenders. (View the Beach Bummers of 2020.)
While scientists remain deeply concerned about water quality issues, there is some good news for beachgoers. 92% of the 500 California beaches monitored by Heal the Bay received an A or B grade for the summer season. During dry weather in the winter season, 91% of beaches received an A or B grade, which was slightly better than average. (Go to pages 5-6 of the report for the full Executive Summary.)
Overall, 42 out of more than 500 monitored California beaches made it on Heal the Bay’s coveted Honor Roll this year, which is higher than last year (33) and the year before (37) likely due to lower than average rainfall. To make it on the Honor Roll the beach must be monitored year-round and score perfect A+ water quality grades each week in all seasons and weather conditions. Most beaches on the Honor Roll are in Southern California because many counties in Central California and Northern California do not sample frequently enough during the winter months. (For the full Honor Roll list, see pages 14-15 of the report.)
The COVID-19 pandemic has upended daily life around the world and has devastated households and communities. We must continue to practice physical distancing and other health and safety procedures, and to keep in mind that a large percentage of people can spread the virus without showing symptoms. The closure of beaches in many locations due to COVID-19 has highlighted the importance of beaches in our lives as open spaces for recreation, relaxation, exploration, and places to gather. But, COVID-19 has also exposed major systemic failures; open spaces, including beaches, are not equally accessible to all people and the public health impacts of health crises as well as poor water and air quality are not shared equally across communities. Low-income communities of color tend to be the most burdened and vulnerable communities, bearing the brunt of environmental and economic impacts. As we plan for the future post-COVID-19, we can and must do better to protect everyone. (Learn more on page 49.)
Heal the Bay is expanding the Beach Report Card to include three beaches in Tijuana, Mexico: El Faro, El Vigia, and Playa Blanca. These popular beaches in Mexico, along with Imperial Beach in California, US, are impacted by millions of gallons of raw sewage that flow into the ocean through the Tijuana River. As a result, the public is at a greater risk for getting ill and local beaches are often closed for months on end. Heal the Bay is partnering with Proyecto Fronterizo de Educación Ambiental to help spread awareness about water quality in Tijuana. Margarita Diaz, Director of Proyecto Fronterizo de Educación Ambiental, says “Showing the integration of what is happening on both the US and Mexican portion of our watershed is a long overdue requirement for understanding environmental health issues—particularly as they relate to water quality in our shared watershed—given that they are intrinsically connected.” (Learn more onpage 50.)
Avoid shallow, enclosed beaches with poor water circulation
Swim at least 100 yards away from flowing storm drains, creeks, and piers
Stay out of the water for at least 72-hours after a rain event
Wear a mask when not in the water and remain at least 6 -feet away from people not from your household at all times
Follow all local health and safety regulations, and check in with the lifeguard on duty for more information about the best places to swim
In analyzing the last thirty years of water quality data, one major finding we uncovered in California was the number of beach and coastal access days the public lost out on due to bacterial-pollution risks.
There have been 66,605 bacterial-pollution exceedance events at California beaches in the last 30 years (Summer Dry, Winter Dry, Wet Weather combined). That’s an average of 2,220 exceedance events per year in California. We estimate the bacterial pollution issue has resulted in 132,130 to 396,390 beach advisory days where the public has not been allowed to access the beach. See pages 22-27 to view an outline of the major policies that the Beach Report Card has influenced over the years as well as whether or not water quality has improved over time.
The annual Beach Report Card includes an analysis of water quality for three time periods: summer dry season (April through October 2019), winter dry weather (November 2019 through March 2020) and year-round wet weather conditions. The grading methodology is endorsed by the State Water Resources Control Board. All county health departments in California are required to test beach water quality samples for fecal indicator bacteria at least once a week during the summer season. Many counties also monitor heavily used beaches year-round. Heal the Bay compiles the complex shoreline data, analyzes it, and assigns an easy-to-understand letter grade.
In addition to providing weekly water quality grades for 500 beaches statewide, Heal the Bay scientists continue to expand NowCast, a daily water quality predictive service at 20 popular beaches in California. Using sophisticated machine learning, environmental science data, modeling, and past bacteria samples, Heal the Bay accurately predicts when beaches should post warning signs because of potential bacterial pollution. This new approach enhances public health protections by providing more advanced water quality information to public health officials and beachgoers.
Heal the Bay’s Beach Report Card is made possible through the generous support from SIMA Environmental Fund, Swain Barber Foundation, and Sony Pictures Entertainment.
For a detailed look at beach results by location, why some beach types are more vulnerable to higher levels of pollution, and detailed report methodology, please refer to our complete report. A PDF version of the 2019-20 annual Beach Report Card is available to download at https://healthebay.org/wp-content/uploads/2020/06/Report-2020_web.pdf
VIEW A RECORDING OF OUR LIVE CONFERENCE
Heal the Bay hosted a live conference on June 30 at Noon to reveal this year’s annual Beach Report Card findings. Speakers included: Dr. Shelley Luce, President and CEO at Heal the Bay, Luke Ginger, Water Quality Scientist at Heal the Bay, Frankie Orrala, Angler Outreach Program Manager at Heal the Bay, and Laurie Silvan, Director of the Board for Proyecto Fronterizo de Educación Ambiental (PFEA). View recording: https://attendee.gotowebinar.com/recording/2147380701854201099
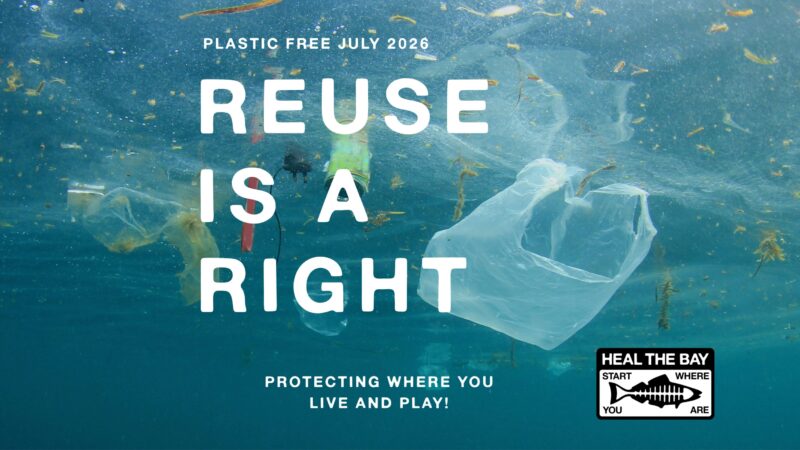
Less than 10% of all plastic ever produced has been recycled.
This Plastic-Free July, Reuse Is a Right. Learn why expanding reusable systems is key to reducing plastic pollution, then take action by signing our petition urging LA leaders to support a reusable future for Los Angeles.


 For the sixth straight summer, Heal the Bay is posting daily water quality predictions for California Beaches on our