

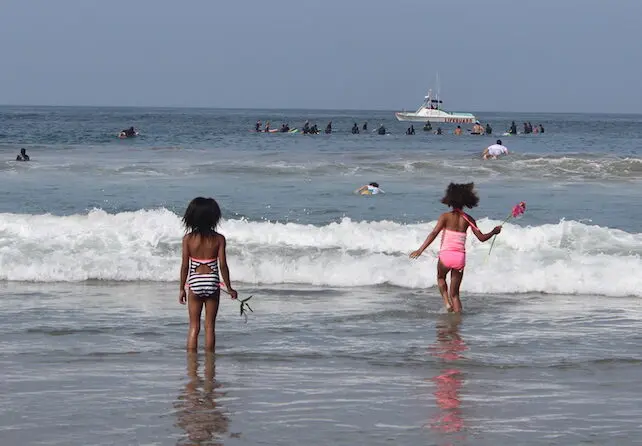
Heal the Bay is stoked to release the 29th annual Beach Report Card, because a day at the beach shouldn’t make anyone sick. This report assigns A-to-F letter grades for 500 California beaches, based on weekly levels of bacterial pollution in the ocean.
So, what did our staff scientists find? Here are our major takeaways:
- California beach water quality sagged in 2018-19, driven in large part by increased rainfall. California often swings from extended dry periods to shorter periods of intense, wet weather. When rains do increase, as we saw in the 2018-2019 winter season, the State of California needs to do a better job of capturing, treating, and reusing runoff so it can be a resource, not a nuisance.
- More rain means more bacteria-ridden runoff carried to the sea via the stormdrain system. Accordingly, bacterial pollution at our local beaches dipped dramatically in 2018-2019. Only 54% of the beaches received an A or B grade during wet weather, which is an eight percentage point decrease from the state’s five-year average.
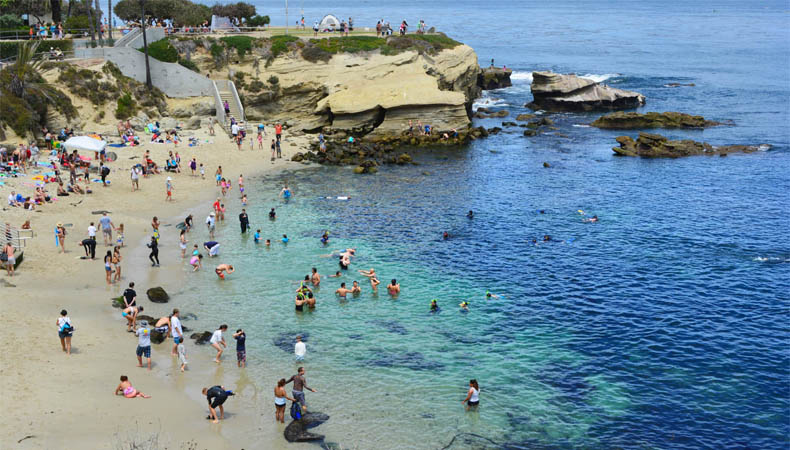
- In a positive sign, Some 94% of the beaches monitored in Southern California earned A grades during the busy summer season.
- Overall, 33 California beaches made it on Heal the Bay’s coveted Honor Roll this year, which is lower than last year (37) likely due to higher than average rainfall. To make it on the Honor Roll the beach must be monitored year-round and score perfect A+ grades each week in all seasons and weather conditions. You can see the full list on page 12 of the report.
- San Clemente Pier in Orange County has the dubious honor of holding the top spot on our Beach Bummer List this year. For the full list, please see page 16 of the report.
- Northern California beaches had excellent summer water quality on par with its five-year average of 94% A’s and B’s. Clam Beach in Humboldt County is the only NorCal beach on the Beach Bummer List. No NorCal beaches made the Honor Roll.
- Central California beaches (which includes San Francisco County) had great water quality during summer months with 92% of its beaches earning an A or B grade. Linda Mar Beach and Aquatic Park in San Mateo County are on the Beach Bummer List along with Cowell Beach in Santa Cruz County. Keller Beach South Beach is new to the Beach Bummer List. Five Central Coast beaches made the Honor Roll.
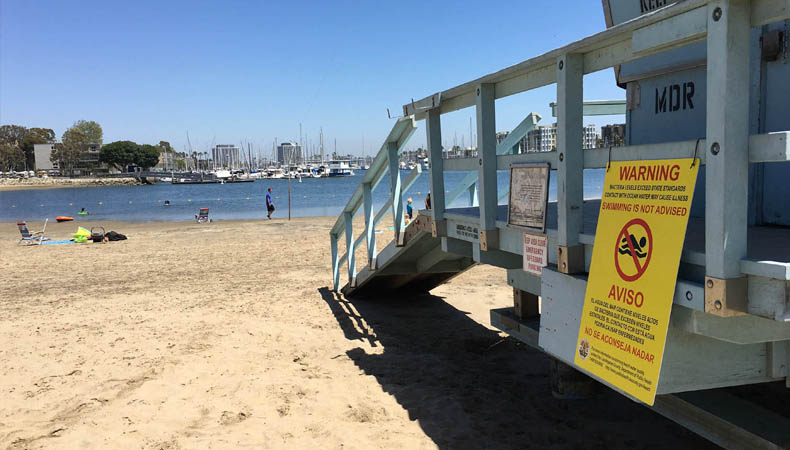
- Southern California beaches had excellent yet slightly below average grades with 95% of the beaches receiving A’s or B’s for their summer dry grades. Five of the Beach Bummers are from SoCal, including the troubled Cabrillo Beach (harborside) and Marina del Rey Mother’s Beach in L.A. County. 28 out of the 33 beaches on the Honor Roll are located in SoCal.
- We investigated the impact of the Woolsey Fire on Malibu beaches and found that water quality grades decreased dramatically after the fire. Wildfires increase runoff due to vegetation loss and infrastructure damage. As the effects of climate change are realized, we can expect more wildfires and more rainfall across coastal areas of California, which can have a negative impact on water quality and public health if no preventative actions are taken to protect our communities and natural habitats.
How to avoid risky water quality at California beaches:
- Check beachreportcard.org for latest water quality grades (available on iOS & Android)
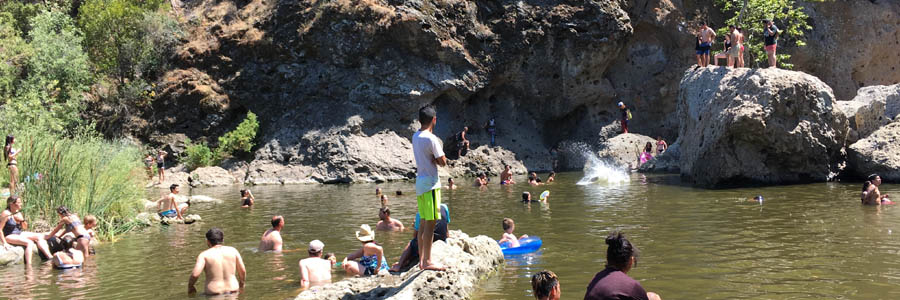
- Avoid shallow, enclosed beaches with poor water circulation
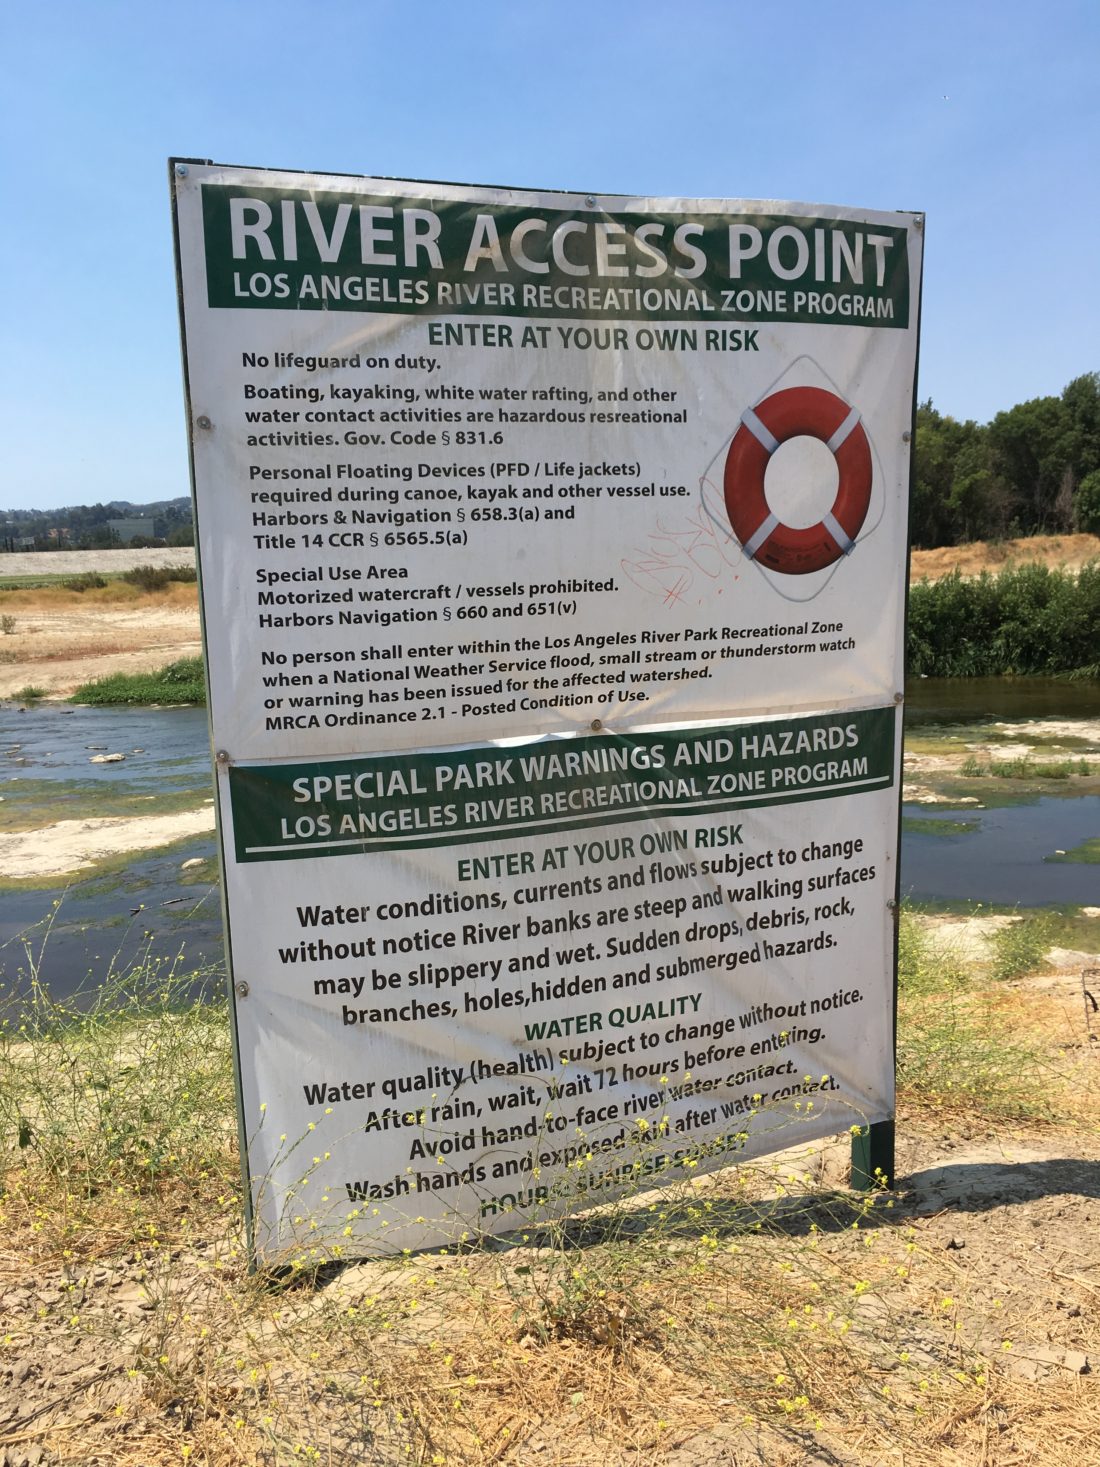
- Swim at least 100 yards away from flowing storm drains, creeks, and piers
- Stay out of the water for at least 72-hours after a rain event
You can get a county-by-county, beach-by-beach breakdown in the full report.
Download our press release.
Download the Executive Summary En Español
About the Beach Report Card with NowCast
The annual Beach Report Card includes an analysis of water quality for three time periods: summer dry season (April through October 2018), winter dry weather (November 2018 through March 2019) and year-round wet weather conditions. The grading methodology is endorsed by the State Water Resources Control Board.
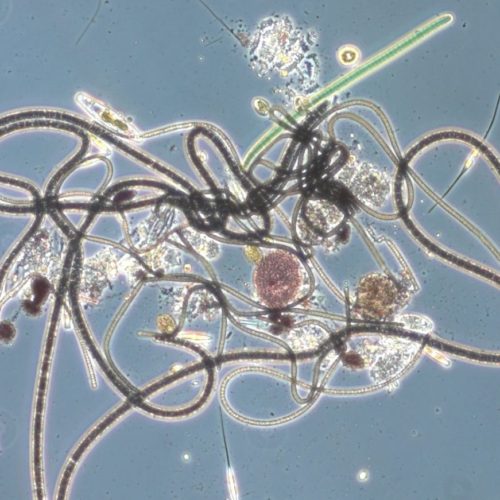
All county health departments in California are required to test beach water quality samples for fecal indicator bacteria at least once a week during the summer season. Many counties also monitor heavily used beaches year-round. Heal the Bay compiles the complex shoreline data, analyzes it, and assigns an easy-to-understand letter grade.
This summer, Heal the Bay scientists will expand NowCast – a daily water quality monitoring service at 20 popular beaches in California – in addition to providing weekly water quality grades for 500 beaches statewide. Using sophisticated machine learning, environmental science data, and past bacteria samples, Heal the Bay accurately predicts each morning when beaches should be posted with warning or open signs because of potential bacterial pollution. These new models will protect public health by providing more advanced water quality information to public health officials and beachgoers.
Heal the Bay’s Beach Report Card is made possible through the generous support of SIMA Environmental Fund, Swain Barber Foundation, and Water Foundation.
For a detailed look at beach results by location, why some beach types are more vulnerable to higher levels of pollution, and detailed report methodology, please refer to our complete report. A PDF version of the 2018-19 annual Beach Report Card is available to download at https://healthebay.org/wp-content/uploads/2019/06/BRC_2019_FINAL2.pdf


 Our NowCast system uses statistical models to provide daily water quality information during the AB411 season. These models predict the concentration of bacteria in the water every morning, and are derived from years of water quality data and a whole lot of environmental variables that impact bacteria levels. NowCasting helps us answer what we don’t readily know – how much bacteria is likely in the water each morning, and thus if it is safe to swim – by looking at what we do know – what was the weather like yesterday, were there a lot of waves this morning stirring up the water, is the nearby river a’ flowing, etc. All of this data crunching and statistical hog-wrestling boils allows us to predict whether beach bacterial concentrations are likely to be safe or hazardous each morning.
 The first major finding of the season was expected: the drought continues to positively impact beach water quality. Think about it like this: less rain means less runoff which means less bacteria in the waves. And as Californians continue to conserve water, there is less dry-weather runoff from outdoor watering (nice work, by the way!). Every beach in the NowCast program (except at the Santa Monica Pier) recorded water samples that came back under sample limits (the levels of bacteria below which it is reasonably safe to swim), much cleaner than those beaches’ historical trends! This is great news for California beachgoers – they were able to enjoy cleaner than average conditions this summer at the NowCast beaches, something that we were able to inform them of on a daily basis.
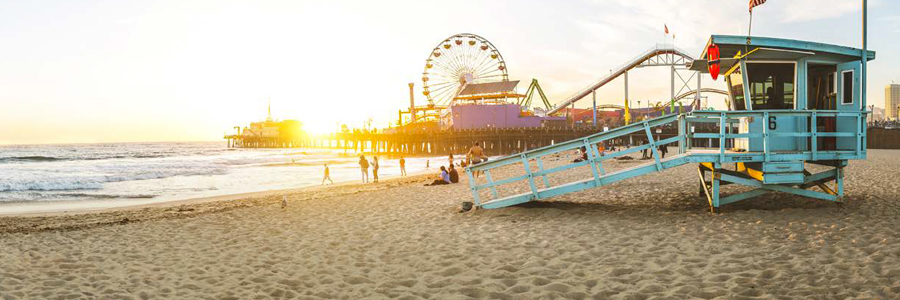
 That being said, we did have one site with more issues than the rest: Santa Monica Pier. The Pier has a chronic history of water quality problems. From 2008-2015, it experienced 28% and 10% exceedance rates for fecal coliform and Enterococcus standards respectively (two types of FIB) in the summer months. This season, it exceeded those FIB standards 41% and 10% of the time respectively, despite drought conditions. This suggests that water quality at Santa Monica Pier is especially affected by other factors in addition to rainfall. Because our models consider wave action, wind speed and direction, and tides, the fecal coliform model for Santa Monica Pier was able to predict 71% of actual exceedances, and 17% more exceedances than using days-old samples in the months of July, August, and September. This was the big result that gives us confidence in our models.
 Looking forward, we’re excited for the California NowCast program to enter its third year. We’ve got a whole bunch of good stuff up next on the menu. For the Summer 2017 season, we are looking to add up to eight new beaches to the program. NowCasting will eventually expand farther along the California coastline, creating a truly statewide program. Winter models at beaches with heavy year-round use are also on our radar (in case you surfers out there were wondering). We’re designing new NowCast beach signage to post on days where water quality is predicted to be poor. And keep an eye out for our groovy new Beach Report Card website and mobile app, an update launching in 2017 that will look and function better than ever, giving beachgoers up to date water quality information on the fly.
 These models are also more accurate than the current method of waiting 24 hours for results to come back from the lab. We launched a pilot program last summer as a proof-of-concept test, and the results were very positive. While we don’t (yet) have the telekinetic powers to predict sewage or oil spills, our models still do a pretty good job of notifying the public each day about local beach conditions.
 Our philosophy at Heal the Bay is that no one should get sick from a day at the beach. To make a decision about which beach is best for them and their family, people should be armed with the most accurate and timely water quality information available. Think of the water quality NowCast just as you do sunscreen – protect yourself from poor water conditions before you get in the water. You should be catching waves, not bugs!