Top

Heal the Bay Blog

September 16, 2016 — There’s a record-breaking number of propositions on California’s general election ballot this year. We created this voter guide to help make your trip to the polls as painless as possible. On November 8 (or earlier, if you’re voting by mail), cast your votes with confidence and remember to Vote Blue!

Heal the Bay's 2016 Voter Guide


Proposition 67: A vote to uphold the ban on single-use plastic carryout bags in California.

The issue: California became the first state in the nation in 2014 to enact plastic bag ban legislation through SB 270, which prohibits grocery stores, convenience stores, and pharmacies from distributing single-use plastic bags, and requires stores to charge a minimum of 10 cents for paper bags. The plastics industry has spent more than $6 million in attempt to overturn California’s plastic bag ban by delaying its implementation by placing this item on the November ballot.

The stakes: Designed for minutes of use, plastic bags do not break down in the environment, and pose a large threat to aquatic life. Over 663 species of marine life have been impacted by ingestion of or entanglement in plastic pollution. By 2050, scientists project that plastic pollution will outweigh fish in our oceans. These lightweight plastic bags also blight our communities and are costly to clean-up. California spends up to $107 million each year managing plastic bag litter.

Our recommendation: Cast your ballot for cleaner beaches and neighborhoods. Vote YES.


Proposition 65: A rival measure to Prop 67 funded by Big Plastic. 

The issue: Prop 65 will deliver little for the environment. It was placed on the ballot by out-of-state plastic bag companies who keep interfering with California’s efforts to reduce plastic pollution. Prop 65 is designed to distract from the environmental priority of defending the state’s plastic bag ban. All Prop 65 would do is direct money from the sale of paper bags to a vaguely defined environmental fund administered by the state.

The stakes: The sole purpose of Prop 65 is to confuse voters. It would only serve the interests of plastic bag companies and would distract from phasing out plastic bags entirely. Prop 65 also fuels the tired paper vs. plastic debate. The real issue is reducing the overall use of single-use bags – be they paper or plastic.

Our recommendation: Prop 65 is a smoke screen. Vote NO.


Measure A*: Safe, clean neighborhood parks and beaches measure of 2016.

The issue: Measure A asks voters to continue their support for local parks, beaches, open space, and water resources by approving an annual parcel tax of 1.5 cents per square foot of development. If approved, the estimated tax for the owner of a 1,500 square foot home will be $22.50 per year, and will be included on the annual property tax bill.  Generating approximately $94 million per year for our local parks, beaches, and open space areas, Measure A will replace expiring dedicated funding from the voter-approved Propositions A of 1992 and 1996.

The stakes: For more than 20 years, our communities have relied on local, voter-approved funding from the Los Angeles County Safe Neighborhood Parks Acts of 1992 and 1996 (Proposition A) to protect and maintain our neighborhood parks, outdoor areas and water resources. However, funding from the 1992 Proposition A ended in 2015 and funding from the 1996 Proposition will end in 2019.

Our recommendation: Updating park infrastructure makes our region more resilient. Vote YES.


Ballot Measure CW**: Funding support for stormwater capture and reuse projects in Culver City. 

The issue: Cities in LA County are required by the Regional Water Quality Control Board to manage pollution from urban runoff flowing through their systems. However, since stormwater services, unlike our other essential utilities, have minimal and in some cases no fees to support them, funding for fulfilling these requirements falls far short of the need. Culver City’s ballot measure would establish fees on property owners to support the stormwater projects the City is required by regulation to complete.

The stakes: Urban runoff is the number one source of pollution to our rivers, lakes and ocean. In addition, losing that volume, which can reach millions of gallons even on a dry day throughout LA County, to the ocean is a wasted opportunity that we can’t afford, especially in the midst of a drought. The proposed fee would support projects that would reduce urban runoff pollution from reaching our waterways, and where possible capture and reuse that water.

Our recommendation: Support cleaner waterways and more local water supply. Vote YES.


*Los Angeles County voters only.

**Culver City voters only.


Got election questions? Not sure when/where/how/if to vote? Visit the Secretary of State’s election FAQ page.


Sept. 6, 2016 — You’d be surprised what you might find at an HTB cleanup. Come join us Sept. 17 for Coastal Cleanup Day, our biggest volunteer event of the year.

First-time cleanup volunteers sometimes arrive with the expectation that they will spend a few hours removing large items of trash from the sand – used tires, abandoned fishing nets, and whatnot.

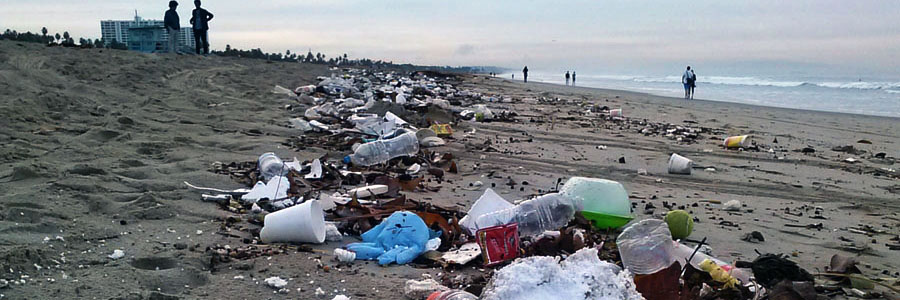
But as any cleanup veteran can tell you, the bulk of our work is picking up and removing small items like Styrofoam shards, plastic bottle caps, or cigarette butts. It’s this dinky detritus of our daily lives that most plagues beaches. It can be tedious at times, but removing tiny pieces of trash most helps marine animals, which often mistakenly ingest harmful bits of plastic and other debris.

To give some perspective, Heal the Bay’s Marine Debris Database reveals that our cleanup volunteers have collected more than 450,000 cigarette butts at L.A. County beaches since 1999. If you laid those butts end to end on the ground, they’d easily surpass the height of Mount Everest!

But it’s not all bits and pieces at our cleanups. Every year at Coastal Cleanup Day – our biggest volunteer event of the year – someone discovers something truly remarkable. Here we look back at some of our favorite finds:

Some volunteers found a (model) human skullHUMAN SKULL

In 2009, police were called in when divers at our Redondo Beach cleanup site found what they believed to be a human skull on the seafloor. Authorities quickly cordoned off the beach and brought forensic teams to examine the weathered skull, which was wrapped in plastic. Creepy! Unfortunately – or fortunately – for our amateur “CSI” wannabes, the skull actually turned out to be a very lifelike anatomical model that would be used in a hospital or medical school setting.

Some volunteers have found up to $100THE BENJAMINS

Forget those crazy dudes with the metal detectors. If you want to find the real big-money action, come to one of our cleanups. Last year, the mayor of Agoura Hills found a wallet in Medea Creek that contained a crisp $100 bill. And in 2010, a group of students at a beach cleanup in Santa Monica found one half of a torn $100 bill. Despite frantic digging, they were unable to find the other half. The good news is that banks will replace your damaged bill if it’s more than 50% of original length and the serial numbers are intact.

Evelyn Bravo-Ayala and Olga AyalaTRUE LOVE

Eveline Bravo-Ayala, our former Beach Program Manager, helped organize hundreds of cleanups during her long tenure here. Little did she know that she’d actually discover her wife at a Coastal Day cleanup. In 2007, Evelyn arranged a series of cleanups in the northeast San Fernando Valley with Olga Ayala, a staffer in Tony Cardenas’ City Council office. The two wrestled for control of the events and often butted heads. But from that rocky start, a tentative friendship blossomed into romance and marriage in 2013.

Evelyn Bravo-Ayala and Olga AyalaBURIED TREASURE

We’ve added a special wrinkle this year — volunteers get to search for “buried treasure” as they pick up trash. Lucky treasure hunters will find “golden sea stars” (don’t worry, they’re fake) hidden in the sand and underbrush at five of our coastal and inland sites. Winners can redeem the sea stars for valuable gift certificates from REI, Patagonia, and Amazon.


On Saturday, 9/17, join us at one of 50 locations throughout L.A. County for this year’s Coastal Cleanup Day!


Register Here


Aug. 25, 2016 — Popular recreation zones in the L.A. River suffer from elevated levels of bacterial pollution, according to a new technical report from Heal the Bay that analyzed water quality during the busy summer season. Here we address concerns people may have and share our vision for a healthier river.

What exactly are “recreation zones” on the L.A. River?
Recreation zones in the Los Angeles River are areas where people are allowed to access the river. Non-motorized boating is allowed in these areas as well as fishing (with a license), walking and bird watching. There are two recreation zones: a two-mile stretch in the Sepulveda Basin (Encino) and a two-and-a-half mile stretch in Elysian Valley (Frogtown). Recreation is also allowed at the mouth of the L.A. River in Long Beach.

The L.A. River is navigableWhy and when were they created?
The L.A. River was designated a “navigable” waterway back in 2010 by the US EPA, meaning that it’s protected by the Clean Water Act. This designation was the result of years of advocacy by many groups, including Friends of the Los Angeles River, NRDC, Heal the Bay, and other environmental groups as well as a group of kayakers and boaters who paddled 51 miles of the river to show that the river is in fact navigable (check out the documentary “Rock the Boat”). In 2011 a pilot recreation program was started in the Sepulveda Basin, and in 2013 the Elysian Valley recreation zone was opened. The zones are open for recreation during the summer months (typically from Memorial Day to the end of September) and during safe flow conditions.

How many people recreate on the L.A. River in a given year?
Every year thousands of people recreate in the L.A. River. In 2014, approximately 6,000 people utilized the recreation zones, according to the Mountains Recreation and Conservation Authority.

Why is Heal the Bay testing water quality on the L.A. River?
Heal the Bay is well known for its Beach Report Card, which has provided A-to-F water quality “grades” each week for over 450 beaches in California since 1990. However, we’ve also been monitoring freshwater rivers, streams and creeks since 1998 through our Stream Team program. We believe that assessing water quality in a variety of waterbodies provides a clearer, more robust picture of environmental health throughout Greater Los Angeles. Recently, our focus has shifted to popular freshwater recreational spots, which, aside from the L.A. River, includes swimming holes in the Santa Monica Mountains.

Trash found in the L.A. RiverWhat kind of bacteria is Heal the Bay testing for?
Heal the Bay tested for two types of fecal indicator bacteria (FIB) — E. coli and Enterococcus. Our staff scientists — led by Dr. Katherine Pease — collected and tested water samples weekly for fecal indicator bacteria at three sites in the two recreation zones in the Sepulveda Basin and Elysian Valley areas of the river over a three-month period in summer 2015. Bacteria levels varied among the sites in the new L.A. River study, but overall were quite high. For example, samples for one type of fecal indicator bacteria, Enterococcus, exceeded federal standards 100% of the time at two sites in Elysian Valley (Rattlesnake Park and Steelhead Park) and 50% of the time in Sepulveda Basin. The Rattlesnake Park site also suffered from a 67% exceedance rate for E. coli.

What illnesses are associated with those bacteria?
FIB, while not necessarily harmful themselves, indicate the possible presence of pathogenic bacteria, which have been found to cause ear infections, skin rashes, respiratory illnesses and gastrointestinal illness. High levels of FIB are particularly concerning in areas where people come in contact with water through activities like swimming, fishing, and kayaking.

How does the bacteria get in the water?
The Total Maximum Daily Load, or TMDL, for the L.A. River identifies several contributors of harmful bacteria to recreational zones along the river: urban runoff, leaks and flows from wastewater collection systems, illicit connections and failing septic systems. Bacteria sources include pets, horses, wildlife, and human waste.

The L.A. River can be lush and greenIs anyone really surprised that the L.A River suffers from poor water quality?
Learning that parts of the river suffered from poor water quality was not a revelation to many Angelenos. The surprise for most people was learning that there were lush, green, navigable parts of the river with actual rapids—portions of the river that actually look like a river. We hope that by spreading awareness of these “wild” spots, people will be more inspired to act as ambassadors for the river’s improvement.

Will I get sick if I go kayaking in the L.A. River?
The odds are that if you go on a kayak trip on the L.A. River you won’t get sick. But there’s always that risk – especially if you don’t follow common safety procedures. We do know that the water quality is uncertain and known to have bacteria levels that are frequently over accepted thresholds. The thresholds that the US EPA and the Regional Water Quality Control Board have put forth are based on epidemiological studies and risk. Recreation in waters that are over accepted bacteria thresholds means that there may be an increased risk of illness when you come in contact with the water. An increased risk of illness is not a guarantee that you will get sick. Certain activities are more risky when water quality is poor; for instance, swimming and submerging your head is more risky than wading; swimming is more risky than kayaking; kayaking is likely more risky than hiking (at least with regards to picking up a waterborne illness), and so on, with the risk dependent on how likely you are to ingest or contact water. Whether we realize it or not, we all make decisions every day based on risk, such as driving a car, eating questionable leftovers, or playing a sport. Deciding what to do with this water quality information depends on the risk level you are comfortable with.

Heal the Bay staff scientists kayaking the L.A. RiverDoes Heal the Bay support kayaking and other recreational uses on the L.A. River?
Heal the Bay has long advocated for public access to and use of open space and waterways, whether it is in Compton Creek, Malibu Creek State Park, Ballona Wetlands, or the beach. Benefits from utilizing these open spaces are clear in terms of individual and community health as well as fostering environmental stewardship and engagement. Less than 10 years ago we worked successfully alongside many partner groups to get US EPA to designate the L.A. River as a navigable waterway, in part so it could be used more for recreational purposes. Experiencing the L.A. River firsthand is an undeniable way to make a connection to a river that needs supporters and advocates; many Heal the Bay staff members and volunteers have kayaked the L.A. River over the years and will continue to do so. We also believe that the public has a right to know what the water quality of the river is and then to make an informed decision about how they want to experience the river.

I want to go kayaking. How do I book a trip?
There are a number of groups who lead kayak tours of the river. You can take your own kayak or steerable non-motorized boat down the river or you can book an individual trip or a group trip through the kayak concessionaires listed here.

What can I do to keep safe if I do go?
Swimming is not allowed in the Sepulveda Basin or Elysian Valley recreation zones. We recommend limiting your contact with the water, particularly avoiding hand-to-face water contact, entering the water with an open wound, if immunocompromised, or after a rainfall. After water contact, we recommend rinsing off with soap and water. We also encourage all visitors to learn about water quality and ask questions. Check the most recent water quality results from Heal the Bay. Bacteria-related water-quality information will be posted on this page weekly during the summer months or open recreation season.

Who is responsible for making sure the river meets clean-water standards?
The Los Angeles Regional Water Quality Control Board has the authority to enforce Clean Water Act guidelines for the L.A. River. The board issues permits and regulations for the L.A. River, such as discharge permits for water reclamation plants, stormwater permits for cities along the River, and Total Maximum Daily Loads (TMDLs) for pollutants, such as bacteria. A TMDL basically sets the amount of pollution that a waterbody can handle while still maintaining its beneficial uses, such as recreation, wildlife habitat, and groundwater recharge. There is a TMDL for bacteria pollution in the L.A. River Watershed; this document identifies entities that contribute to bacterial pollution and sets limits and timelines to achieve reductions in pollution.

The L.A. River can be quite picturesqueWhat does Heal the Bay envision for the river in the next few years?
We envision a river where people can explore, kayak, fish, and even swim without fear of getting sick. However, this goal is likely many years away. In order for this vision to be realized, community members and municipal and non-governmental agencies need to work together to support efforts aimed at reducing pollution in the river, such as stormwater capture projects. Heal the Bay is also advocating for more flexible funding options to support these projects. Understanding the impact that we as individuals can have is also key to making behavioral changes that can improve the quality of runoff entering the river – picking up after our pets, properly managing our trash, and not overwatering our lawns or washing our cars in the street.

In the meantime, Heal the Bay hopes to see readily available water quality information for people visiting the river, as well as more informative signage so that people understand the simple precautions they can take to minimize their risk of illness. Further, we will push for immediate abatement actions to reduce bacterial inputs, particularly in dry weather. For instance, if a stormdrain is determined to be a major source of bacteria, a low-flow diversion should be explored, where the runoff is diverted to the sewer system to be treated instead of reaching the L.A. River.

Group of kayakers on the L.A. RiverWhat can I do to help improve water quality on the L.A River?
Heal the Bay was founded on the principle of concerned citizens standing together to right an environmental wrong. In 1985, we pressured the Hyperion Wastewater Treatment Plant to improve its treatment process and stop discharging sludge into Santa Monica Bay. The same principle can be applied to the improvement and stewardship of the Los Angeles River. If enough people are aware of the problem, and commit themselves to collaboratively finding solutions, a healthy, clean L.A. River is within reach.

We urge Angelenos to explore and get to know their river, to pay attention to conversations about the River happening at council meetings and other agencies and make sure that their voices are also heard in these venues, and to support efforts that will lead to lasting change and improvements in the water quality of the river.

This FAQ is available in Spanish here.


Aug. 17, 2016 —  Just departed president Alix Hobbs made asking the hard questions look easy, writes Communications Director Matthew King.

No. It’s one of the simplest words in the English language, but often one of the hardest to say.

Heal the Bay has a team of passionate advocates whose heads are filled with big ideas. These well-meaning initiatives, cooked up in the excitement of a brainstorming meeting or a flurry of overly optimistic emails, can quickly take a life of their own. Other priorities established weeks ago are set aside, as the team chases the new concept like 8-year-olds scurrying in unison after a soccer ball at a Saturday AYSO game.

The problem with good ideas is that they are just ideas – and often not very good ones. (“Hey, let’s create a giant sea star on the beach made of glued-together cigarette butts!”) Pursuing them costs time and money – two of any nonprofit’s most precious assets.

Heal the Bay, like any well-run organization, simply needs someone smart to say No. Someone to ask the hard questions. For many years that person was Alix Hobbs, our just departed president.

It isn’t an easy job, nor a glamorous one, but it’s critical to our success. She had to make choices on matters as mundane as selecting our credit card company, and as soul-shaking as personnel reductions. And during my nine-year tenure here, Alix did it with conviction, fairness and a clear sense of purpose.

Nonprofits love to hold meetings.  We discuss items to death. We form subcommittees to offer preferred alternatives. Everyone has a voice, and consensus is desperately sought. But ultimately someone has to make a decision. And lately that fell to Alix in her duties overseeing Heal the Bay for the past two years.

A naval commander’s daughter, Alix was to the captain’s bridge born. When faced with a decision, she surveys the options as if scanning the open sea. After careful consideration, amid often conflicting voices, she’ll speak in a firm, clear voice about which way to point the boat. That confidence is reassuring to a busy crew seeking calm in the middle of a minor squall.

Alix had grown up professionally at the organization, serving capably in a variety of roles for nearly 20 years – from volunteer to Coastal Cleanup Day coordinator to Programs Director. But some of her greatest work came serving largely behind the scenes as Associate Director during the tenure of past president Mark Gold. Essentially acting as our CFO, she made sure the trains ran on time — managing budgets, overseeing operations, shepherding grants — so our policy and education teams could do their amazing work.

Then the board threw her into a new challenge – settling the HTB ship after a few turbulent years. As our new chief, she was tasked with spearheading the creation and adoption of a comprehensive 10-year strategic plan. She also was asked to lead a fundraising campaign to solidify our financial foundation as the regional economy finally woke from its slumber.

Speaking directly and confidently with the media and general public, Alix made my job as Communications Director easier. Statuesque with preppy good looks, she exudes self-assurance. I once told her that she reminded me of the dark-haired actress Ali MacGraw. She quickly shot back: “Who’s Ali MacGraw?,” making me feel a thousand years old. (If you’re under 40, you can Google “Love Story” or “Steve McQueen’s wife.”)

But Alix and I occasionally butted heads over the years, be it about staffing levels in my department or the tone of an email blast. I’m a right-brain type, acting on instinct and intuition; she’s a left-brainer, guided by reason and analytics. We usually approached a potential problem from differing perspectives. But we typically came to an agreement that best served the organization. To her credit, she trusted me to do my job and always gave me creative latitude and authority.
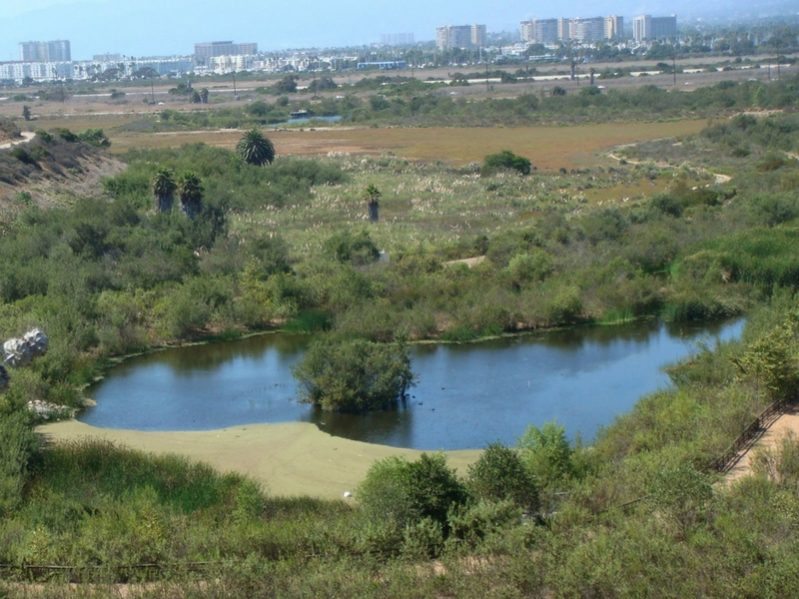
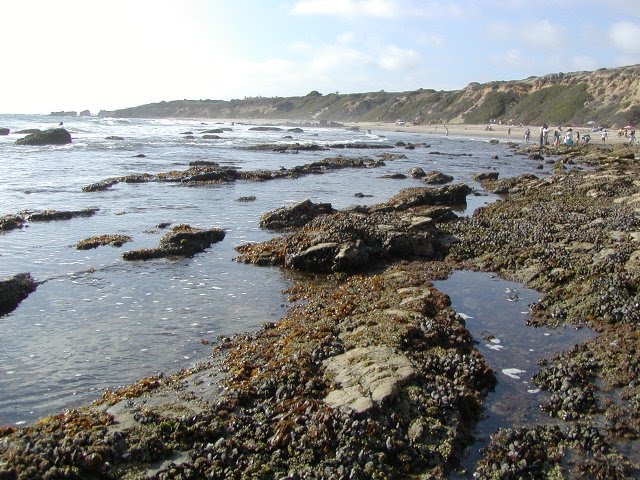
Having fulfilled her mandate, Alix is now moving on and has accepted a job as president of the Crystal Cove Alliance in Newport Beach. She’ll get a chance to test out her entrepreneurial skills and expand her management chops in the hospitality field.

The good news is that Alix will remain connected to Heal the Bay. She has accepted a voting position on our board of directors and will have a voice in our future direction.
With respect and gratitude, I look forward to hearing many more No’s from her.


Aug. 15, 2016 — Longtime board member takes reins from Alix Hobbs, who is departing for new job running the Crystal Cove Alliance in Orange County.

Heal the Bay’s board of directors has announced that Stephanie Medina will serve as interim president and CEO following the recent departure of  Alix Hobbs as chief of the environmental nonprofit.

Medina, a longtime board member and past chairman, will assume responsibility for financial, operational and strategic oversight of the organization.
She will share management duties with vice president Sarah Sikich, who oversees science and policy initiatives. In the coming months, the board will pursue a leadership search that includes both internal and external candidates.

The move follows the board of directors’ adoption of comprehensive 10-year strategic plan spearheaded by Hobbs, as well as a highly successful fundraising campaign to solidify the group’s financial foundation amid a slowly recovering regional economy.

Hobbs, a nearly 20-veteran of the Santa Monica-based nonprofit, has accepted a job as president of the Crystal Cove Alliance in Newport Beach. She will remain connected to Heal the Bay, and has accepted a voting position on our board of directors.

“The Heal the Bay family is exactly that — a family of devoted, passionate, capable and smart people,” said Hobbs. “So stepping away after all these years is emotional. But I depart knowing that we have left the next generation with something much better than what we inherited.”

A San Fernando Valley resident, Medina has held several management positions in the nonprofit and media sectors. She most recently served as a senior vice president of community relations for the Special Olympics’ World Games 2015, following positions directing Public Affairs at broadcast stations KTLA and KCAL/KCBS. She also served on the city of Los Angeles’ Transportation Commission.

“Having served on the board for so many years, I got to see the good work that our staff and volunteers do,” said Medina. “But now I get to come into our office every day! I couldn’t be more honored to lead the team in our next phase of growth.”

As part of its new strategic plan, the staff and board of Heal the Bay is focusing on three key directional goals in the coming decade:

  • To better protect public health, we will work to ensure that people can swim and fish at every beach in L.A. County without risk of getting sick.
  • To ensure a more sustainable water future, we will work to ensure that L.A. County sources 60% of its water locally through conservation and reuse by 2025.
  • To restore the vibrancy of our local oceans and watersheds, we will work to ensure that all greater L.A. coastal and river habitats are healthy.


For 2017 grades, please see our River Report Card.

Heal the Bay’s inaugural study of Los Angeles River microbial water quality that we published July 27, 2016 and last year’s study on swimming holes in the Santa Monica Mountains called for more readily available public water quality information. The public has a right to know about water quality conditions in these freshwater recreation areas so that they can make informed decisions on how to minimize the risk of getting sick.
We will be posting an update every Friday during the summer with water quality information from our weekly sampling of freshwater recreation sites in Los Angeles County.

Malibu Creek State Park – Number of Exceedances
Site Name9/29/169/21/169/15/169/7/168/31/168/24/168/17/168/10/168/3/16
Rock Pool0 out of 4

None of the four criteria exceed the threshold values this week at Rock Pool site in Malibu Creek. The single sample E. coli value was below the threshold of 235 MPN/100ml, and the geometric mean for E. coli was below 126 MPN/100ml. The single sample Enterococcus value was also below the threshold of 110 MPN/100ml as was the geometric mean value for Enterococcus (below 30 MPN/100ml). Since June 15, 2016, we have documented exceedance rates (for single samples) of 20% for E. coli and 13% for Enterococcus at this site.
0 out of 4

None of the four criteria exceed the threshold values this week at Rock Pool site in Malibu Creek. The single sample E. coli value was below the threshold of 235 MPN/100ml, and the geometric mean for E. coli was below 126 MPN/100ml. The single sample Enterococcus value was also below the threshold of 110 MPN/100ml as was the geometric mean value for Enterococcus (below 30 MPN/100ml). Since June 15, 2016, we have documented exceedance rates (for single samples) of 21% for E. coli and 14% for Enterococcus at this site.
0 out of 4

None of the four criteria exceed the threshold values this week at Rock Pool site in Malibu Creek. The single sample E. coli value was below the threshold of 235 MPN/100ml, and the geometric mean for E. coli was below 126 MPN/100ml. The single sample Enterococcus value was also below the threshold of 110 MPN/100ml as was the geometric mean value for Enterococcus (below 30 MPN/100ml). Since June 15, 2016, we have documented exceedance rates (for single samples) of 23% for E. coli and 15% for Enterococcus at this site.
1 out of 4

Only one of the four criteria exceeds the threshold values this week at Rock Pool site in Malibu Creek. The single sample E. coli value was below the threshold of 235 MPN/100ml, and the geometric mean for E. coli was below 126 MPN/100ml. The single sample Enterococcus value was also below the threshold of 110 MPN/100ml but the geometric mean value for Enterococcus was over the threshold of 30 MPN/100ml. Since June 15, 2016, we have documented exceedance rates (for single samples) of 25% for E. coli and 17% for Enterococcus at this site.
1 out of 4

Only one of the four criteria exceeds the threshold values this week at Rock Pool site in Malibu Creek. The single sample E. coli value was below the threshold of 235 MPN/100ml, and the geometric mean for E. coli was below 126 MPN/100ml. The single sample Enterococcus value was also below the threshold of 110 MPN/100ml but the geometric mean value for Enterococcus was over the threshold of 30 MPN/100ml. Since June 15, 2016, we have documented exceedance rates (for single samples) of 27% for E. coli and 18% for Enterococcus at this site.
2 out of 4

Two of the four criteria exceed the threshold values this week at Rock Pool site in Malibu Creek. The single sample E. coli value was below the threshold of 235 MPN/100ml, and the geometric mean for E. coli was below 126 MPN/100ml. In contrast, both the single sample and geometric mean values for Enterococcus were over their respective thresholds. Since June 15, 2016, we have documented exceedance rates (for single samples) of 30% for E. coli and 20% for Enterococcus at this site.
1 out of 4

One of the four criteria exceeds the threshold values this week at Rock Pool site in Malibu Creek. For both E. coli and Enterococcus, the single sample values were under their respective thresholds. The geometric mean value for E. coli was under its threshold, while Enterococcus was over its threshold. Since June 15, 2016, we have documented exceedance rates (for single samples) of 33% for E. coli and 11% for Enterococcus at this site.
2 out of 4

Two of the four criteria exceed the threshold values this week at Rock Pool site in Malibu Creek. For both E. coli and Enterococcus, the single sample values were under their respective thresholds but the geometric mean values were over the thresholds. Since June 15, 2016, we have documented exceedance rates (for single samples) of 33% for E. coli and 12% for Enterococcus at this site.
3 out of 4

Three of the four criteria exceed the threshold values this week at Rock Pool site in Malibu Creek. For E. coli, the single sample and geometric mean values were over threshold values; the single sample Enterococcus value was under the threshold of 110 MPN/100ml but the geometric mean value was over the threshold value. Since June 15, 2016, we have documented exceedance rates (for single samples) of 43% for E. coli and 14% for Enterococcus at this site.
Las Virgenes Creek at the Bridge1 out of 4

Only one of the four criteria exceed the threshold values this week at Las Virgenes Creek at the bridge. The single sample E. coli value was below the threshold of 235 MPN/100ml, and the geometric mean for E. coli was below 126 MPN/100ml. The single sample Enterococcus value was also below the threshold of 110 MPN/100ml but the geometric mean value for Enterococcus was over the threshold of 30 MPN/100ml. Since June 15, 2016, we have documented exceedance rates (for single samples) of 27% for E. coli and 53% for Enterococcus at this site.
3 out of 4

Three of the four criteria exceed the threshold values this week at Las Virgenes Creek at the bridge. The single sample E. coli value was below the threshold of 235 MPN/100ml but the geometric mean value for E. coli was over the threshold of 126 MPN/100ml.The single sample Enterococcus value was over the threshold of 110 MPN/100ml and the geometric mean value for Enterococcus was over the threshold of 30 MPN/100ml. Since June 15, 2016, we have documented exceedance rates (for single samples) of 29% for E. coli and 57% for Enterococcus at this site.
2 out of 4

Two of the four criteria exceed the threshold values this week at Las Virgenes Creek at the bridge. The single sample E. coli value was below the threshold of 235 MPN/100ml but the geometric mean value for E. coli was over the threshold of 126 MPN/100ml.The single sample Enterococcus value was below the threshold of 110 MPN/100ml but the geometric mean value for Enterococcus was over the threshold of 30 MPN/100ml. Since June 15, 2016, we have documented exceedance rates (for single samples) of 31% for E. coli and 54% for Enterococcus at this site.
2 out of 4

Two of the four criteria exceed the threshold values this week at Las Virgenes Creek at the bridge. The single sample E. coli value was below the threshold of 235 MPN/100ml but the geometric mean value for E. coli was over the threshold of 126 MPN/100ml.The single sample Enterococcus value was below the threshold of 110 MPN/100ml but the geometric mean value for Enterococcus was over the threshold of 30 MPN/100ml. Since June 15, 2016, we have documented exceedance rates (for single samples) of 33% for E. coli and 58% for Enterococcus at this site.
3 out of 4

Three of the four criteria exceed the threshold values this week at Las Virgenes Creek at the bridge. The single sample and geometric mean values for E. coli value were both over their respective thresholds of 235 MPN/100ml and 126 MPN/100ml. The single sample Enterococcus value was below the threshold of 110 MPN/100ml but the geometric mean value for Enterococcus was over the threshold of 30 MPN/100ml. Since June 15, 2016, we have documented exceedance rates (for single samples) of 36% for E. coli and 64% for Enterococcus at this site.
3 out of 4

Three of the four criteria exceed the threshold values this week at Las Virgenes Creek at the bridge. The single sample E. coli value was below the threshold of 235 MPN/100ml, while the geometric mean for E. coli was over 126 MPN/100ml. Both the single sample and geometric mean values for Enterococcus were over their respective thresholds. Since June 15, 2016, we have documented exceedance rates (for single samples) of 30% for E. coli and 70% for Enterococcus at this site.
4 out of 4

Four of the four criteria exceed the threshold values this week at Las Virgenes Creek at the bridge. The single sample E. coli value was above the threshold of 235 MPN/100ml, and the geometric mean for E. coli was over 126 MPN/100ml. Similarly, both the single sample and geometric mean values for Enterococcus were over their respective thresholds. Since June 15, 2016, we have documented exceedance rates (for single samples) of 33% for E. coli and 67% for Enterococcus at this site.
3 out of 4

Three of the four criteria exceed the threshold values this week at Las Virgenes Creek at the bridge. The single sample E. coli value was below the threshold of 235 MPN/100ml but the geometric mean for E. coli was over 126 MPN/100ml, and both the single sample and geometric mean values for Enterococcus were over their respective thresholds. Since June 15, 2016, we have documented exceedance rates (for single samples) of 25% for E. coli and 62% for Enterococcus at this site.
3 out of 4

Three of the four criteria exceed the threshold values this week at Las Virgenes Creek at the bridge. The single sample E. coli value was below the threshold of 235 MPN/100ml but the geometric mean for E. coli was over 126 MPN/100ml, and both the single sample and geometric mean values for Enterococcus were over their respective thresholds. Since June 15, 2016, we have documented exceedance rates (for single samples) of 29% for E. coli and 57% for Enterococcus at this site.
Los Angeles River – Number of Exceedances
Site Name9/27/169/20/169/13/169/6/168/30/168/23/16
Steelhead Park, Elysian Valley1 out of 4

Only one of the four criteria exceeds the threshold values this week at the Steelhead Park site for the Los Angeles River. The single sample E. coli value was below the threshold of 235 MPN/100ml, and the geometric mean for E. coli was below 126 MPN/100ml. The single sample Enterococcus value was also below the threshold of 110 MPN/100ml but the geometric mean value for Enterococcus was over the threshold of 30 MPN/100ml. Since May 31, 2016, we have documented exceedance rates (for single samples) of 6% for E. coli and 61% for Enterococcus at this site.
1 out of 4

Only one of the four criteria exceeds the threshold values this week at the Steelhead Park site for the Los Angeles River. The single sample E. coli value was below the threshold of 235 MPN/100ml, and the geometric mean for E. coli was below 126 MPN/100ml. The single sample Enterococcus value was also below the threshold of 110 MPN/100ml but the geometric mean value for Enterococcus was over the threshold of 30 MPN/100ml. Since May 31, 2016, we have documented exceedance rates (for single samples) of 6% for E. coli and 65% for Enterococcus at this site.
1 out of 4

Only one of the four criteria exceeds the threshold values this week at the Steelhead Park site for the Los Angeles River. The single sample E. coli value was below the threshold of 235 MPN/100ml, and the geometric mean for E. coli was below 126 MPN/100ml. The single sample Enterococcus value was also below the threshold of 110 MPN/100ml but the geometric mean value for Enterococcus was over the threshold of 30 MPN/100ml. Since May 31, 2016, we have documented exceedance rates (for single samples) of 6% for E. coli and 69% for Enterococcus at this site.
1 out of 4

Only one of the four criteria exceeds the threshold values this week at the Steelhead Park site for the Los Angeles River. The single sample E. coli value was below the threshold of 235 MPN/100ml, and the geometric mean for E. coli was below 126 MPN/100ml. The single sample Enterococcus value was also below the threshold of 110 MPN/100ml but the geometric mean value for Enterococcus was over the threshold of 30 MPN/100ml. Since May 31, 2016, we have documented exceedance rates (for single samples) of 7% for E. coli and 73% for Enterococcus at this site.
2 out of 4

Two of the four criteria exceed the threshold values this week at the Steelhead Park site for the Los Angeles River. The single sample E. coli value was below the threshold of 235 MPN/100ml, and the geometric mean for E. coli was below 126 MPN/100ml. In contrast, both the single sample and geometric mean values for Enterococcus were over their respective thresholds (110 and 30 MPN/100ml). Since May 31, 2016, we have documented exceedance rates (for single samples) of 7% for E. coli and 79% for Enterococcus at this site.
2 out of 4

Two of the four criteria exceed the threshold values this week at the Steelhead Park site for the Los Angeles River. The single sample E. coli value was below the threshold of 235 MPN/100ml, and the geometric mean for E. coli was below 126 MPN/100ml. In contrast, both the single sample and geometric mean values for Enterococcus were over their respective thresholds. Since May 31, 2016, we have documented exceedance rates (for single samples) of 8% for E. coli and 77% for Enterococcus at this site.
Rattlesnake Park, Elysian Valley3 out of 4

Three of the four criteria exceed the threshold values this week at the Rattlesnake Park site for the Los Angeles River. The single sample value for E. coli was below the threshold of 235 MPN/100ml, but the geometric mean for E. coli was over the threshold of 126 MPN/100ml. Both the single sample and geometric mean values for Enterococcus were also over their respective thresholds (110 and 30 MPN/100ml). Since May 31, 2016, we have documented exceedance rates (for single samples) of 50% for E. coli and 100% for Enterococcus at this site.
4 out of 4

All four of the criteria exceed the threshold values this week at the Rattlesnake Park site for the Los Angeles River. The single sample and geometric mean values for E. coli value were above the thresholds of 235 and 126 MPN/100ml, respectively. Both the single sample and geometric mean values for Enterococcus were also over their respective thresholds (110 and 30 MPN/100ml). Since May 31, 2016, we have documented exceedance rates (for single samples) of 53% for E. coli and 100% for Enterococcus at this site.
4 out of 4

All four of the criteria exceed the threshold values this week at the Rattlesnake Park site for the Los Angeles River. The single sample and geometric mean values for E. coli value were above the thresholds of 235 and 126 MPN/100ml, respectively. Both the single sample and geometric mean values for Enterococcus were also over their respective thresholds (110 and 30 MPN/100ml). Since May 31, 2016, we have documented exceedance rates (for single samples) of 50% for E. coli and 100% for Enterococcus at this site.
3 out of 4

Three of the four criteria exceed the threshold values this week at the Rattlesnake Park site for the Los Angeles River. The single sample E. coli value was below the threshold of 235 MPN/100ml, but the geometric mean for E. coli was over 126 MPN/100ml. Both the single sample and geometric mean values for Enterococcus were over their respective thresholds (110 and 30 MPN/100ml). Since May 31, 2016, we have documented exceedance rates (for single samples) of 47% for E. coli and 100% for Enterococcus at this site.
3 out of 4

Three of the four criteria exceed the threshold values this week at the Rattlesnake Park site for the Los Angeles River. The single sample E. coli value was below the threshold of 235 MPN/100ml, but the geometric mean for E. coli was over 126 MPN/100ml. Both the single sample and geometric mean values for Enterococcus were over their respective thresholds (110 and 30 MPN/100ml). Since May 31, 2016, we have documented exceedance rates (for single samples) of 50% for E. coli and 100% for Enterococcus at this site.
4 out of 4

Four of the four criteria exceed the threshold values this week at the Rattlesnake Park site for the Los Angeles River. The single sample E. coli value was above the threshold of 235 MPN/100ml, and the geometric mean for E. coli was over 126 MPN/100ml. Similarly, both the single sample and geometric mean values for Enterococcus were over their respective thresholds. Since May 31, 2016, we have documented exceedance rates (for single samples) of 54% for E. coli and 100% for Enterococcus at this site.
Sepulveda Basin at Burbank Blvd.1 out of 4

Only one of the four criteria exceeds the threshold values this week at the Sepulveda Basin site for the Los Angeles River. The single sample E. coli value was below the threshold of 235 MPN/100ml, and the geometric mean for E. coli was below 126 MPN/100ml. The single sample Enterococcus value was also below the threshold of 110 MPN/100ml but the geometric mean value for Enterococcus was over the threshold of 30 MPN/100ml. Since May 31, 2016, we have documented exceedance rates (for single samples) of 0% for E. coli and 6% for Enterococcus at this site.
1 out of 4

Only one of the four criteria exceeds the threshold values this week at the Sepulveda Basin site for the Los Angeles River. The single sample E. coli value was below the threshold of 235 MPN/100ml, and the geometric mean for E. coli was below 126 MPN/100ml. The single sample Enterococcus value was also below the threshold of 110 MPN/100ml but the geometric mean value for Enterococcus was over the threshold of 30 MPN/100ml. Since May 31, 2016, we have documented exceedance rates (for single samples) of 0% for E. coli and 7% for Enterococcus at this site.
2 out of 4

Two of the four criteria exceed the threshold values this week at the Sepulveda Basin site for the Los Angeles River. The single sample E. coli value was below the threshold of 235 MPN/100ml, and the geometric mean for E. coli was below 126 MPN/100ml. In contrast, both the single sample and geometric mean values for Enterococcus were over their respective thresholds. Since May 31, 2016, we have documented exceedance rates (for single samples) of 0% for E. coli and 8% for Enterococcus at this site.

We envision safe swimmable rivers and creeks throughout Los Angeles County. However, a number of recreational waterbodies are not regularly monitored or monitored at all. We know thousands of Angelenos use these aquatic resources.

As such, Heal the Bay would rather provide some information about the water quality they are immersing themselves into rather than no information. The idea is to prompt the user to ask questions about these waterbodies: What is the origin of the water? Can I get sick from it? What types of illnesses can I get? How do I get more information? Check out the answers to these questions and more in our FAQ and the joint statement on recreation in the L.A. River.

Malibu Creek State Park testing sites mapL.A. River testing sites map

Heal the Bay has been monitoring water quality in streams and rivers since 1998 through our Stream Team program. In 2014 we initiated a pilot study to monitor human use and water quality at freshwater swimming spots in the Santa Monica Mountains, focusing on bacterial pollution and public health implications. We are currently in our third summer of monitoring water quality in those swimming locations. Given Heal the Bay’s 25-year history of informing and educating beachgoers about beach water quality through our Beach Report Card, assessing the water quality of the Los Angeles River recreation zones was a natural next step. We are now in our second season of monitoring for the L.A. River recreation zones.

The A-to-F grading system of the Beach Report Card took years of work to develop and fine-tune. We are only in the very early stages of thinking about an analogous River Report Card. But we want to start by making basic water quality information available to the public in a timely manner.

We will be providing weekly information about levels of fecal indicator bacteria at five sites. We will report on whether the sample from the current week exceeded limits set by the Regional Water Quality Control Board and US EPA and what the microbial water quality has been over the summer sampling season thus far.

We will report on two types of fecal indicator bacteria, or FIB: E. coli and Enterococcus. FIB, while not harmful themselves, indicate the possible presence of pathogenic bacteria, which have been found to cause ear infections, skin rashes, respiratory illnesses and gastrointestinal illness. High levels of FIB are particularly concerning in areas where people come in contact with water through activities like swimming, fishing, and kayaking.

Excuse us for getting technical in this next section, but we just want to be clear about what we are measuring and what constitutes an exceedance.

We compare bacteria levels measured at each site to water quality objectives from the Total Maximum Daily Loads (TMDL) for Bacteria in the Malibu Creek Watershed and the Los Angeles River Watershed as well as EPA’s 2012 Recreational Water Quality Criteria (RWQC)

The freshwater regulatory limit for E. coli is set in the TMDL at 235 MPN/100ml for a single sample and 126 MPN/100ml for the geometric mean. (A geometric mean is a type of average that results in a number that is not as heavily affected by very high or very low values).

We calculate geometric means from all samples over the last 30-day period (usually four or five samples). For Enterococcus, we used EPA’s statistical threshold value for an illness rate of 32/1,000 (the more protective rate), which is 110 MPN/100ml for a single sample and 30 MPN/100ml for the geometric mean in a fresh waterbody designated for recreation.

For each site, we will report on the number of criteria that exceeded four standards. A site can have 0-4 out of four exceedances. A sample exceeds if:

  • E. coli single sample > 235 MPN/100ml
  • E. coli geometric mean > 126 MPN/100ml
  • Enterococcus single sample is > 110 MPN/100ml
  • Enterococcus geometric mean is > 30 MPN/100ml

So, what does that all mean?

The greater the number and magnitude of exceedances at a site, the worse the water quality is, indicating a potentially increased risk of getting sick.

Deciding what to do with this information depends on the risk level you are comfortable with. Single sample values give you an indication of the most recent water quality, while geometric mean values give you an indication of the ambient water quality over the last 30 days.

However, it is important to note that the single sample gives information for the day on which the sample was taken and conditions can change throughout the week until the next sample is taken.

The thresholds that the US EPA and the RWQCB have put forth are based on epidemiological studies and risk. An increased risk of illness is not a guarantee that you will get sick. Certain activities are more risky when water quality is poor; for instance, swimming and submerging your head is more risky than wading; swimming is more risky than kayaking; kayaking is likely more risky than hiking (at least with regards to picking up a waterborne illness), and so on, with the risk dependent on how likely you are to ingest or contact water.

We recommend following these best practices to stay safe and healthy.

  • Swimming: In waters known to exceed bacterial limits, swimming is not recommended, particularly submerging one’s head. Elevated bacteria levels can occur at any time. Swimmers should use caution when entering the water by checking the latest water quality results, avoiding contact immediately after a rainfall, if they are immunocompromised, or if they have an open wound. If there is any water contact, then rise off with soap and water afterward.
  • Kayaking and Fishing: In waters that are known to exceed bacterial limits, people should limit water contact, especially avoiding hand-to-face water contact. Users should not enter the water with an open wound, if immunocompromised, or after a rainfall. If there is any water contact, then rinse off with soap and water afterward.


Aug, 5, 2016 — Staff scientist Katherine Pease launches our Freshwater Friday blog post, providing weekly updates on the latest bacterial exceedances at popular recreational zones

Heal the Bay’s inaugural study of Los Angeles River microbial water quality that we published last week and last year’s study on swimming holes in the Santa Monica Mountains called for more readily available public water quality information. The public has a right to know about water quality conditions in these freshwater recreation areas so that they can make informed decisions on how to minimize the risk of getting sick.

So beginning today with our Santa Monica Mountains sites, we will be posting a blog post every Friday during the summer with water quality information from our weekly sampling of freshwater recreation sites in Los Angeles County. (You can see this week’s findings at the bottom of this page, but first we want to explain our intent and methodology.)

We envision safe swimmable rivers and creeks throughout Los Angeles County. However, a number of recreational waterbodies are not regularly monitored or monitored at all. We know thousands of Angelenos use these aquatic resources.

As such, Heal the Bay would rather provide some information about the water quality they are immersing themselves into rather than no information. The idea is to prompt the user to ask questions about these waterbodies: What is the origin of the water? Can I get sick from it? What types of illnesses can I get? How do I get more information? We will be posting a Frequently Asked Questions document next week to help answer some of these questions.

Heal the Bay has been monitoring water quality in streams and rivers since 1998 through our Stream Team program. In 2014 we initiated a pilot study to monitor human use and water quality at freshwater swimming spots in the Santa Monica Mountains, focusing on bacterial pollution and public health implications.

The A-to-F grading system of the Beach Report Card took years of work to develop and fine-tune. We are only in the very early stages of thinking about an analogous River Report Card. But we want to start by making basic water quality information available to the public in a timely manner.

We will be providing weekly information about levels of fecal indicator bacteria at five sites. We will report on whether the sample from the current week exceeded limits set by the Regional Water Quality Control Board and US EPA and what the microbial water quality has been over the summer sampling season thus far.

We will report on two types of fecal indicator bacteria, or FIB: E. coli and Enterococcus. FIB, while not harmful themselves, indicate the possible presence of pathogenic bacteria, which have been found to cause ear infections, skin rashes, respiratory illnesses and gastrointestinal illness. High levels of FIB are particularly concerning in areas where people come in contact with water through activities like swimming, fishing, and kayaking.

Excuse us for getting technical in this next section, but we just want to be clear about what we are measuring and what constitutes an exceedance.

We compare bacteria levels measured at each site to water quality objectives from the Total Maximum Daily Loads (TMDL) for Bacteria in the Malibu Creek Watershed and EPA’s 2012 Recreational Water Quality Criteria (RWQC)

The freshwater regulatory limit for E. coli is set in the TMDL at 235 MPN/100ml for a single sample and 126 MPN/100ml for the geometric mean. (A geometric mean is a type of average that results in a number that is not as heavily affected by very high or very low values).

We calculate geometric means from all samples over the last 30-day period (usually four or five samples). For Enterococcus, we used EPA’s statistical threshold value (for an illness rate of 32/1,000 (the more protective rate), which is 110 MPN/100ml for a single sample and 30 MPN/100ml for the geometric mean in a fresh waterbody designated for recreation.

For each site, we will report on the number of criteria that exceeded four standards. A site can have 0-4 out of four exceedances. A sample exceeds if:

E. coli single sample > 235 MPN/100ml 

E. coli geometric mean > 126 MPN/100ml

Enterococcus single sample is > 110 MPN/100ml

Enterococcus geometric mean is > 30 MPN/100ml

So, what does that all mean?

The greater the number and magnitude of exceedances at a site, the worse the water quality is, indicating a potentially increased risk of getting sick.

Deciding what to do with this information depends on the risk level you are comfortable with. Single sample values give you an indication of the most recent water quality, while geometric mean values give you an indication of the ambient water quality over the last 30 days.

However, it is important to note that the single sample gives information for the day on which the sample was taken and conditions can change throughout the week until the next sample is taken.

The thresholds that the US EPA and the RWQCB have put forth are based on epidemiological studies and risk. An increased risk of illness is not a guarantee that you will get sick. Certain activities are more risky when water quality is poor; for instance, swimming and submerging your head is more risky than wading; swimming is more risky than kayaking; kayaking is likely more risky than hiking (at least with regards to picking up a waterborne illness), and so on, with the risk dependent on how likely you are to ingest or contact water.

We recommend following these best practices to stay safe and healthy.

  • Swimming: In waters known to exceed bacterial limits, swimming is not recommended, particularly submerging one’s head. Elevated bacteria levels can occur at any time. Swimmers should use caution when entering the water by checking the latest water quality results, avoiding contact immediately after a rainfall, if they are immunocompromised, or if they have an open wound. If there is any water contact, then rise off with soap and water afterward.
  • Kayaking and Fishing: In waters that are known to exceed bacterial limits, people should limit water contact, especially avoiding hand-to-face water contact. Users should not enter the water with an open wound, if immunocompromised, or after a rainfall. If there is any water contact, then rinse off with soap and water afterward.

Malibu Creek State Park

for the week ending August 3, 2016

1. Rock Pool: Three exceedances

Three of the four criteria exceed the threshold values this week at Rock Pool site in Malibu Creek. For E. coli, the single sample and geometric mean values were over threshold values; the single sample Enterococcus value was under the threshold of 110 MPN/100ml but the geometric mean value was over the threshold value. Since June 15, 2016, we have documented exceedance rates (for single samples) of 43% for E. coli and 14% for Enterococcus at this site.

2. Las Virgenes Creek at the bridge: Three exceedances

Three of the four criteria exceed the threshold values this week at Las Virgenes Creek at the bridge. The single sample E. coli value was below the threshold of 235 MPN/100ml but the geometric mean for E. coli was over 126 MPN/100ml, and both the single sample and geometric mean values for Enterococcus were over their respective thresholds. Since June 15, 2016, we have documented exceedance rates (for single samples) of 29% for E. coli and 57% for Enterococcus at this site.


Aug. 2, 2016 — A day at the beach shouldn’t make you sick, writes Ryan Searcy, our new beach water quality modeler. He’s totally stoked about NowCasting — our new method for predicting pollution levels at popular beaches.

Curious what the weather in Big Bear will be like this weekend? Whether there will be good surf at Malibu this evening? How bad traffic will be on the 405 during your morning commute? It’s easy to get answers to these questions, thanks to your trusty mobile device.

Well ocean-lovers, we have some good news to share: you can now add water quality at beaches across the state to the list of on-demand forecasts that are easily accessible from your phone!

Heal the Bay, in partnership with Stanford University and UCLA, has officially rolled out its NowCast tool in California, a new water-quality forecasting system that promises a whole new way of keeping swimmers safe at their favorite beaches. Thinking of hanging out at the beach near Santa Monica Pier this weekend? Now you can find out that same day if it’s safe to swim or not before making the long drive (or Metro trip) out west.

NowCast Excel SpreadsheetNowCasting is a technique that uses predictive statistical models to forecast water quality at a beach based on observed environmental conditions — such as rainfall, waves, tides and past bacteria concentrations. Just as the weatherman on the 11 p.m. news predicts if it will be sunny for your birthday tomorrow, Heal the Bay’s staff scientists are able to predict if it is safe to swim at a given beach on any given morning.

Under the current monitoring protocol, health officials determine if a beach is safe or not by sampling for indicator bacteria (organisms whose presence suggests that other, more harmful bacteria and viruses are also present). Unfortunately, monitoring results do not come back from the lab for 24-48 hours.

In that time, beach conditions may very well have changed from when the sample was taken, potentially exposing ocean users to bacterial pollution. Additionally, most beaches in California are only sampled for bacteria once a week, leaving it to the public to decide whether to recreate or not based on days-old information.

Our new NowCast program fills these gaps.

Using years of environmental and bacteria sampling data, our team has developed complex models to predict the concentration of indicator bacteria on a daily basis. If the bacteria level is predicted by the NowCast system to be above the acceptable standards set by the state, then water quality is assumed to be poor, and a beach posting is recommended. A new prediction will then be made the following day. And the day after that…

Arroyo Burro Beach, courtesy of Damian Gadal, FlickrThese models are also more accurate than the current method of waiting 24 hours for results to come back from the lab. We launched a pilot program last summer as a proof-of-concept test, and the results were very positive. While we don’t (yet) have the telekinetic powers to predict sewage or oil spills, our models still do a pretty good job of notifying the public each day about local beach conditions.

Over the last few decades, water quality in the Santa Monica Bay (and across the state) has improved dramatically. However, there is still much work to be done to clean up our beaches and reduce the number of swimmers, surfers, divers and other ocean users that get sick.

Predictions are made every morning during the summer based on current environmental conditions. Local health agencies can then use these predictions to notify the public of water conditions before most people arrive to the beach. For the remainder of this summer, you can find NowCast predictions for the following five beaches:

  • Arroyo Burro (Hendry’s) in Santa Barbara
  • East Beach (near Mission Creek) in Santa Barbara
  • Santa Monica Pier
  • Belmont Pier in Long Beach
  • Doheny State Beach in Orange County

Arroyo Burro, Santa Monica Pier, and Doheny State Beach were on our radar last year, and all had models that performed well. East Beach and Belmont Pier were added on this year because of good data availability and plenty of willingness from the local health agencies to help implement the program. Over the next three years, we plan to add an additional 15-20 beaches and expand the program across California — from the breezy beaches of San Francisco to the classic surf spots of San Diego.

Ryan Searcy - Beach Water Quality ModelerOur philosophy at Heal the Bay is that no one should get sick from a day at the beach. To make a decision about which beach is best for them and their family, people should be armed with the most accurate and timely water quality information available. Think of the water quality NowCast just as you do sunscreen – protect yourself from poor water conditions before you get in the water. You should be catching waves, not bugs!

Download our beach report card app on your mobile device or head to beachreportcard.org to find daily predictions for all of the NowCast beaches mentioned above. You can also access the lastest grades for our full complement of beaches that we monitor each week statewide — more than 400 beaches up and down the coast!

Download the Beach Report Card App from the App StoreDownload the Beach Report Card App from Google Play


Become a Heal the Bay Community Advocate and inspire others to make a difference!

Attend our Community Advocates Training to learn how to communicate our work, educate others about the impacts of ocean pollution, and represent Heal the Bay at various outreach events, such as the KROQ Weenie Roast, Santa Monica Festival, and many more!
This is a great opportunity for those who wish to speak directly to the public about the issues that affect our local waters and watersheds.
Plus who doesn’t want some cool Heal the Bay swag? Earn your Heal the Bay t-shirt today!

Wednesday, August 10th, 2016

  • Heal the Bay Main Office (snacks provided)
  • 6:00P.M. – 8:00 P.M.

To RSVP, click here.

To learn more about Community Advocates, please click here.

We’ll have plenty of outreach events coming up during Earth Month (April), so sign up today!

Required: Attendance to a Heal the Bay Volunteer Orientation. Check the calendar for upcoming orientations.


Join Heal the Bay’s prestigious Speakers Bureau!

For over 25 years Speakers Bureau has been an integral part of Heal the Bay’s mission. Speaker Bureau volunteers spread educational awareness to schools, organizations and businesses about the causes and consequences of ocean pollution, water issues, and what everyone can do to help. Just last year we were able to reach out to over 30,000 LA County residents!

Classroom Training Session Dates:
Tuesday, August 9th, 1:00pm – 4:30pm
Tuesday, August 16th, 12:00pm – 4:30pm (includes a tour of the Environmental Learning Center from 12 – 1pm!)
Tuesday, August 23rd, 1:00pm – 4:30pm

Location:
Environmental Learning Center at the Hyperion Treatment Plant
12000 Vista Del Mar, Los Angeles, CA 90293

Field Training Session Dates:
Saturday, August 20th, 10:00am – 12:00pm
Redondo Beach Pier South (Tower Ruby)
Redondo Beach, CA 90277

Attendance at all sessions is mandatory – we cover a lot of important information. Make the commitment to protect what you love! Come learn how to make a difference for your community and inspire others – no matter where you live, you can make an impact! Learn more about the program.

REGISTER HERE

You can make a suggested donation of $25 to cover your training costs when you register! We hope to see you there!